Advanced Event Detection
This is a more advanced example of Event Detection. It continues on from the Basic Event Detection Tutorial.
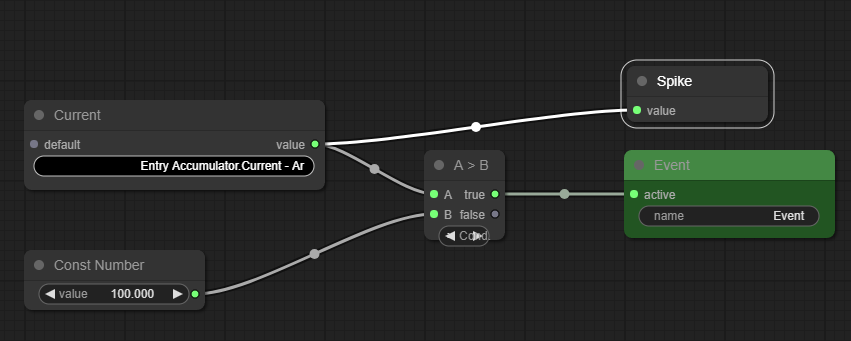
By the end of the first example, we've got the following graph.
Note - for clarity, we'll remove the 'Spike' metadata in the following examples.
Step 1: Ignoring Inrushes with a Custom Timer
One problem comes from inrush currents and high loads. These are moments of very high current use when the drive is starting up or when a particularly heavy product is being processed.
What makes this complicated is that the time-limits we're willing to accept change depending on just how far over the limits it actually is
For example, the motor can run at 102% for an hour without any danger, but should only run at 120% for 60 seconds - otherwise it might overheat or fail.
So rather than a traditional timer node, we might need to make our own.
Add a New Variable
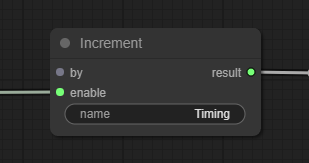
You can use variables to store information. In this case, we're going to make a variable called Total Time to act as a counter.
- Right-click in the empty space, choose Add Node, Variables and Increment.
- Click on the name option and enter 'Total Time'.
- Connect the true output of the comparison node to the enable output of the new Increment node.
Add a Value to Increment By
Although your analytic usually runs with 1 second resolution (if enough data is available), there are situations where it won't.
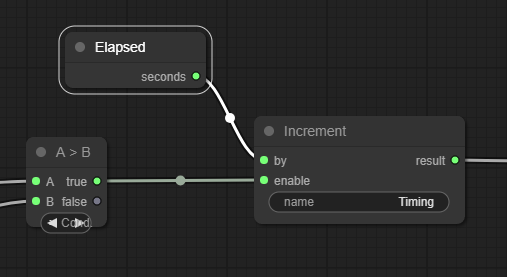
Because of that, we can't simply add 1 to our timer. To be safe, we should add an Elapsed node that gives us the correct number of seconds since the last sample.
- Right click in empty space, choose Add Node, Timing and Elapsed.
- Connect the output of the Elapsed node to the enabled input of the Increment node.
Reset the Timer When OK
Right now, we've made a counter that constantly counts up - it never falls back down.
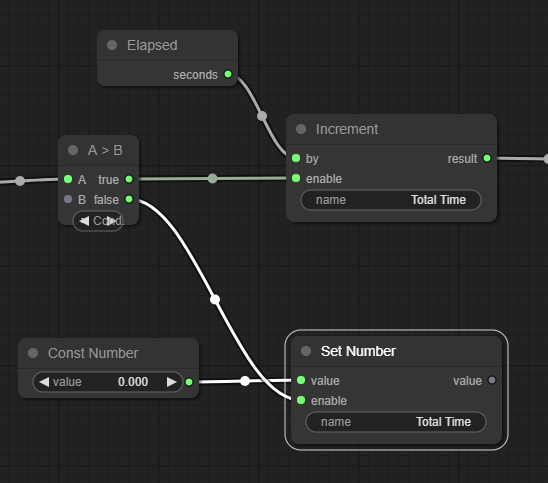
To let us reset the timer, we can add a Set node.
What we need to do here is set the value of the variable back to 0 whenever the power drops down under 100%.
- Right-click in empty space, choose Add Nodes, Variable and Set.
- Left-click the name option on the new node and type 'Total Time'.
- Create a new Basic/Const Number node.
- Click the value in the Const Number node and change it to '0'.
- Connect the output of the Const Number node to the value input of the Set node.
- Connect the false from the comparison node to the enabled on the Set node.
So our new nodes will…
- Increment the Total Time as long as the measured power is > 100%, and
- Reset the Total Time whenever the power is ⇐ 100%.
We can now adjust our logic by adding a new condition - we want to create an event only if the value of Total Time is greater than 5 (meaning 5 seconds have elapsed).
Step 2: Adjusting Timing Based On Difference
Right now, we've got a fixed time for our timer. If we're running at 101%, we're allowing 5 seconds before we consider it a problem. If we're running at 120%, we're also allowing 5 seconds.
What we need is to modify our timing based on how big a difference there is between our target (ie. 100%) and our actual value.
To figure out how severely we're over the limit, we'll make a change in our logic.
Determine the Difference
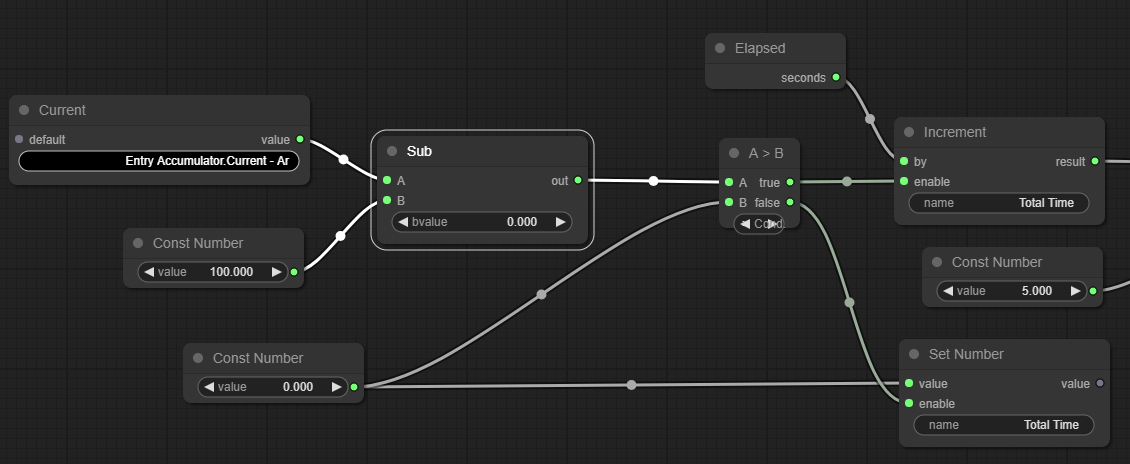
Instead of checking if the measured current is greater than 100%, we're going to subtract the maximum current from the actual current. If this number is positive, it means we're over the threshold.
- Right-click the background and choose Add Node, Math and Subtract.
- Connect the ARDI Point to the 'A' input of the subtraction node.
- Connect the '100' constant number to the 'B' input of the subtraction node.
- Connect the output of the subtraction node to the 'A' input of the comparison node.
- Connect the '0' constant number to the 'B' input of the comparison node.
We can now divide the time threshold by the difference in value.
Assuming we set a delay time of 120 seconds (2 minutes), this would mean that we'd see the following timings…
| Power Usage | Time Allowed |
|---|---|
| 101% | 120s (2 Minutes) |
| 102% | 60s (1 Minute) |
| 110% | 12s |
| 120% | 6s |
This gives us a response curve close to what we're looking for.
In this case, we're actually going to do this slightly differently - rather than divide the time threshold, we're going to multiply the time we're counting, by adding a Multiply node between the Elapsed and Increment nodes we made earlier.
Although you'd initially think this is the same, it actually gives us a subtle difference in behaviour.
If our value spiked up to 120% for 5 seconds and then dropped down to 101% and stayed there, the timings would look like this…
| Method | Time Until Event Detected |
|---|---|
| Divide | 120 seconds |
| Multiply | 20 seconds |
