Pivot Example: By Events
In this example, we're going to use a pivot analytic to see how our different shifts and crews are performing.
This will help point out any shifts that are struggling to meet targets.
Available Information
| Asset | Property | Desc |
|---|---|---|
| Facility | Production Rate | The current rate of production |
| Event Types | Description |
|---|---|
| Outage Schedule | Scheduled and unscheduled outage time-frames |
| Shifts and Crews | Includes the start time, end time and name of the shift from the roster |
Initial Layout
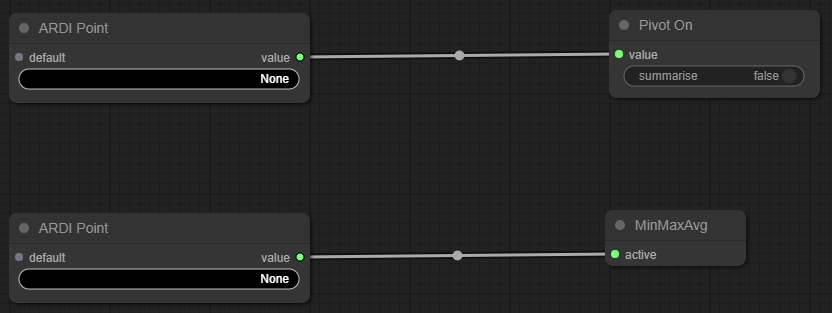
To begin with, we have one Pivot node named Pivot On, and one Pivot Output node named MinMaxAvg
These are both fed by ARDI Point nodes, bringing data in from ARDI asset properties.
Step 1: Choose the Pivot
Our first step is to choose what we are going to pivot on.
In this case, we don't want an ARDI property data - we want an event.
Replace the Point
- Right-click on the top-left Point node and choose Delete.
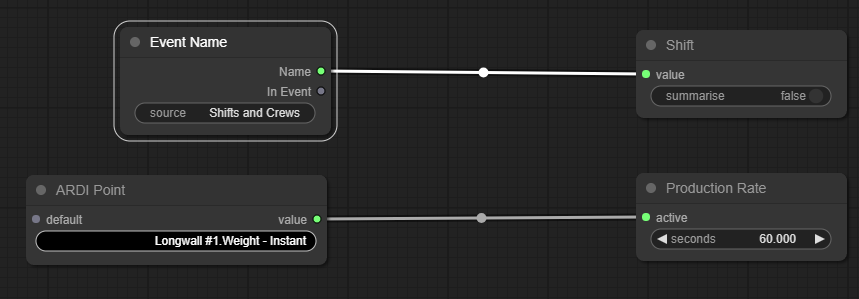
- Right-click in empty space and choose Add Node, ARDI and Event Name.
- Left-click on the Source option and write 'Shifts and Crews' as the event source name.
- Right-click on the Pivot, choose Title from the menu, and call it 'Shift'
Step 2: Add Rates
Because we are dealing with people, we need to consider how we can report fairly.
Since our shift lengths can vary, we want to capture totals, but we want to show rates over time. This way, Shift A can be directly compared to Shift B.
Since we're dealing with a rate, we'll need to get rid of our existing MinMaxAvg node, and replace it with something specifically made for dealing with measurements over time.
Remove the Min/Max/Avg
- Right-click on the MinMaxAvg node and choose Delete from the menu.
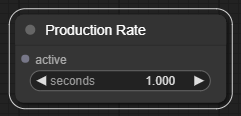
- Right-click the empty space and choose Add Node, Report and Rate.
- Right-click the new node, choose Title and type 'Production Rate'
Connect and Scale
Next, we need to connect our rate to our sensors, and set up the time scaling. In this case, the sensor returns a value in tonnes per minute, while the Rate node expects a value in seconds.
Although you could use math nodes to do the work of bringing the value down to seconds, we've provided a shortcut - the Rate node has a seconds option you can set to the the number of seconds the input is scaled in.
- Left-click on None in the remaining ARDI Point node, and choose Facility Production Rate.
- Connect the node you just edited to the Production Rate node.
- Enter '60' in the seconds property of the Production Rate, so it knows our value is per-minute rather than per-second.
Step 3: Ignoring Scheduled Outages
As mentioned before, it's important to be fair when comparing the output of different staff members or groups.
Part of that is not penalising them for things out of their control.
One easy way to do this is to make the analytic ignore any scheduled downtime your system might experience.
Luckily, we have a calendar of scheduled events being read into ARDI. So we can use the In Event node to let us know if there's a scheduled outage.
Add An Ignore Node
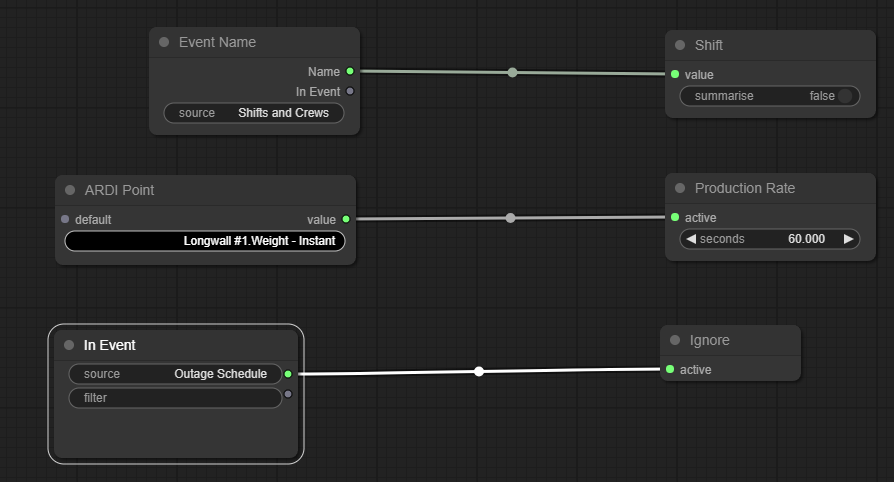
- Right-click in empty space and choose Add Node, Report and Ignore.
Ignore When In An Event
- Right-click in an empty space and choose Add Node, ARDI and In Event.
- Enter Outage Schedule as the name of the event source.
- Leave Filter blank.
- Connect the first output to the input of the Ignore node.
Analytic Complete
And this has given us quick and easy shift and crew reporting, combining your sensor and machine data with your staff and maintenance schedules.
Refining
One way to possibly refine this would be to ignore down-times that aren't the fault of the crews.
Although we've removed scheduled down-time, there's still the chance of outages caused by people other than our crews (for example, there might be a blackout or problem with conveyors).
We can introduce extra logic (along with some AND nodes) to our Ignore to make sure that our crews are only considered responsible for the time they potentially could have been producing.


