Asset Data Shape
The Asset Data Shape FirstSite analytic is designed to indicate if an asset is behaving as expected.
Unlike most of the other analytics provided by FirstSite, this one needs human interaction before it can work. Because of this, the status for each of the results will be empty until you've gone in and trained them.
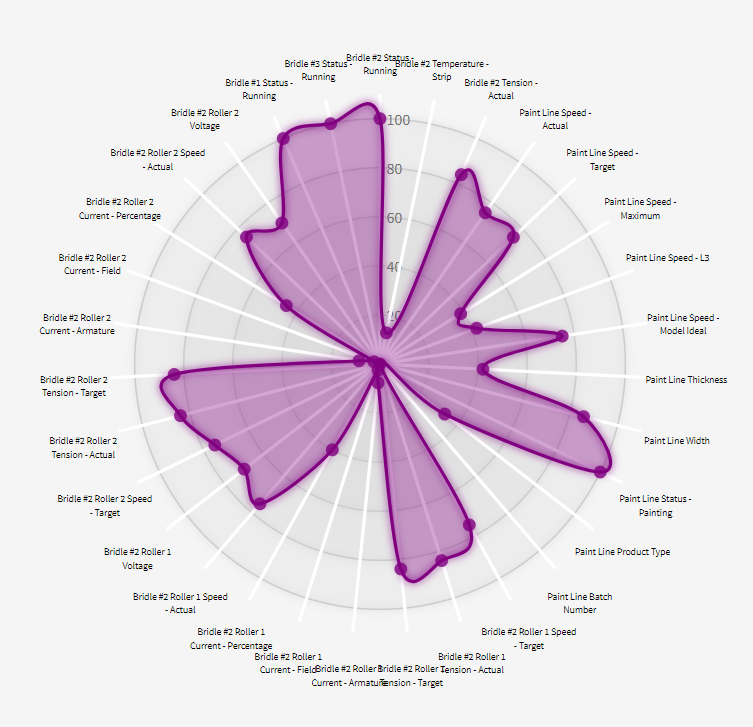
The analytic looks at the 'shape' that is created when you gather all of the points associated with an asset in one place.
This includes the information from the asset itself, upstream assets, assets inside it and all of its parents in the Location hierarchy.
The asset used in the above example only had a single property (Running). But the analytic contains other data from…
- Equipment upstream (Strip Temperature & Incoming Tension)
- Sub-components (Current, Voltage, Tension & Speed x2)
- The machine it's part of (Running)
- The process as a whole (Product Type, Thickness, Width, Target Speed & Painting Status)
Detail UI
The UI for type tests is explained here.
Learning The Ideal Shape
Initially, FirstSite has no idea what 'good' looks like for this asset. It won't offer any opinion of if the data looks good or bad.
You can use Machine Learning to teach FirstSite what the 'shape' of this chart is supposed to look like by pressing the This Is Normal button.
Once you've given it a few examples to work with, the AI will then be able to look at your values and let you know if your system is running in a normal or abnormal way.
Training Complex Systems
If your system runs in a variety of different modes or configurations, you might need to train the AI several times to give it examples of the various shapes your data can be in.
For example, if you run your machine in different modes or on different types of product, you'll need to press the This Is Normal several times, exposing it to new process conditions.
Remember that the AI is looking at your process as a complete idiot, so it will sometimes alert you thanks to completely irrelevant changes to your data. You simply have to add more training samples so it can learn that those changes are irrelevant.
In the example above, Product Type was one of the properties making up the shape of our chart. If your system changes to a new product, the AI will probably say that your asset is running abnormally - simply because it's never seen this particular shape before.
Training/Viewing Past Data
You can view a sequence for a past date by adding the 'at' parameter to the URL of the test detail UI.
Let's say we knew that Machine 1 (from the previous example) last ran between 9:00 and 11:00 on the 20th of December, 2023.
After adjusting the time to UTC/Greenwich Mean Time, we could then add 'at=2023-12-20 09:30:00' to our URL
Deployment Options
As well as running through FirstSite, your limit analytics can be deployed as a live alert.
