
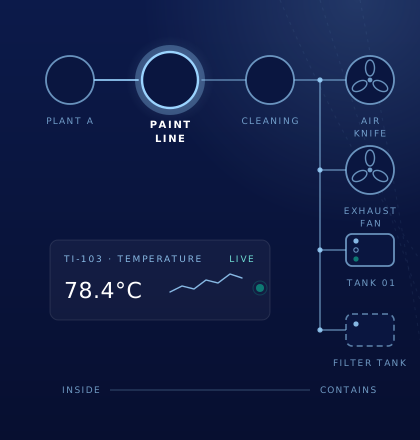
Industrial data is everywhere. Operational understanding is not.
Most industrial environments aren’t short on data – they’re short on a way to find it and understand what it means.
Tag names are convoluted, hierarchies are partial or missing, and the same asset appears in six different ways across six systems. Even once it’s found, the data doesn’t explain how things actually work together.
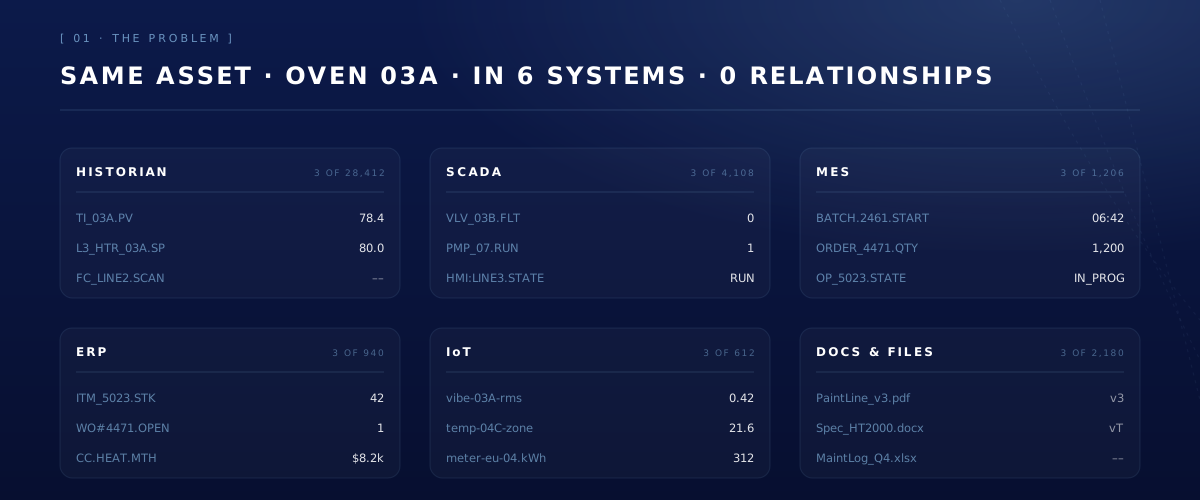
Hard to find
Cryptic tag names, scattered systems and missing hierarchies make even locating the right piece of data its own challenge.
Hard to understand
Raw data doesn’t capture how assets, processes and systems work together – that context stays in people’s heads, not in the data.
Hard to scale
Each new dashboard, report or AI use case rebuilds the same operational context from scratch.
From source systems to operational understanding.
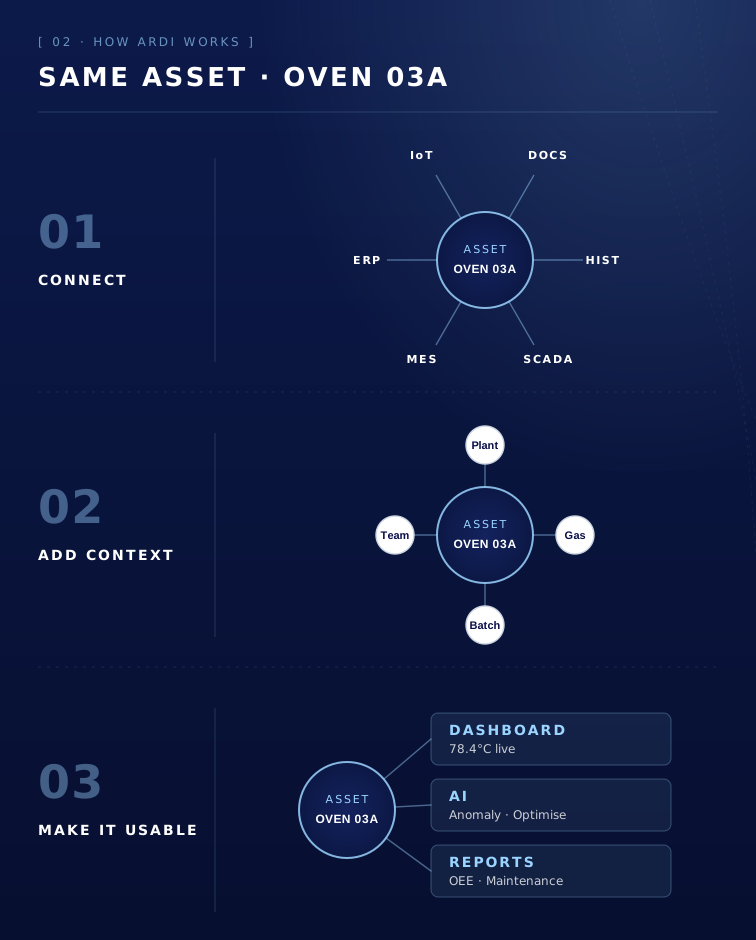
ARDI connects to your source systems, models the relationships that explain how your operation works, and delivers that data through open industrial standards – without replacing your existing systems.
Connect
Reach data where it already lives – historians, SCADA, maintenance, quality and more – without moving or replacing the source systems.
Data stays where it is, and live, historical and business data become available from one consistent source.
Model relationships
Define how assets, equipment, processes and systems actually relate, so data reflects how your plant really works.
This turns disconnected data into a clear, meaningful operational view.
Deliver and apply
Expose context-rich data through dashboards, applications and open industrial standards such as OPC-UA, UNS, i3X, REST and MCP – and apply it through ARDI’s integrated tools for analytics, AI, optimisation, diagnostics and decision support, all running on the same operational model.
Where relationships turn data into understanding.
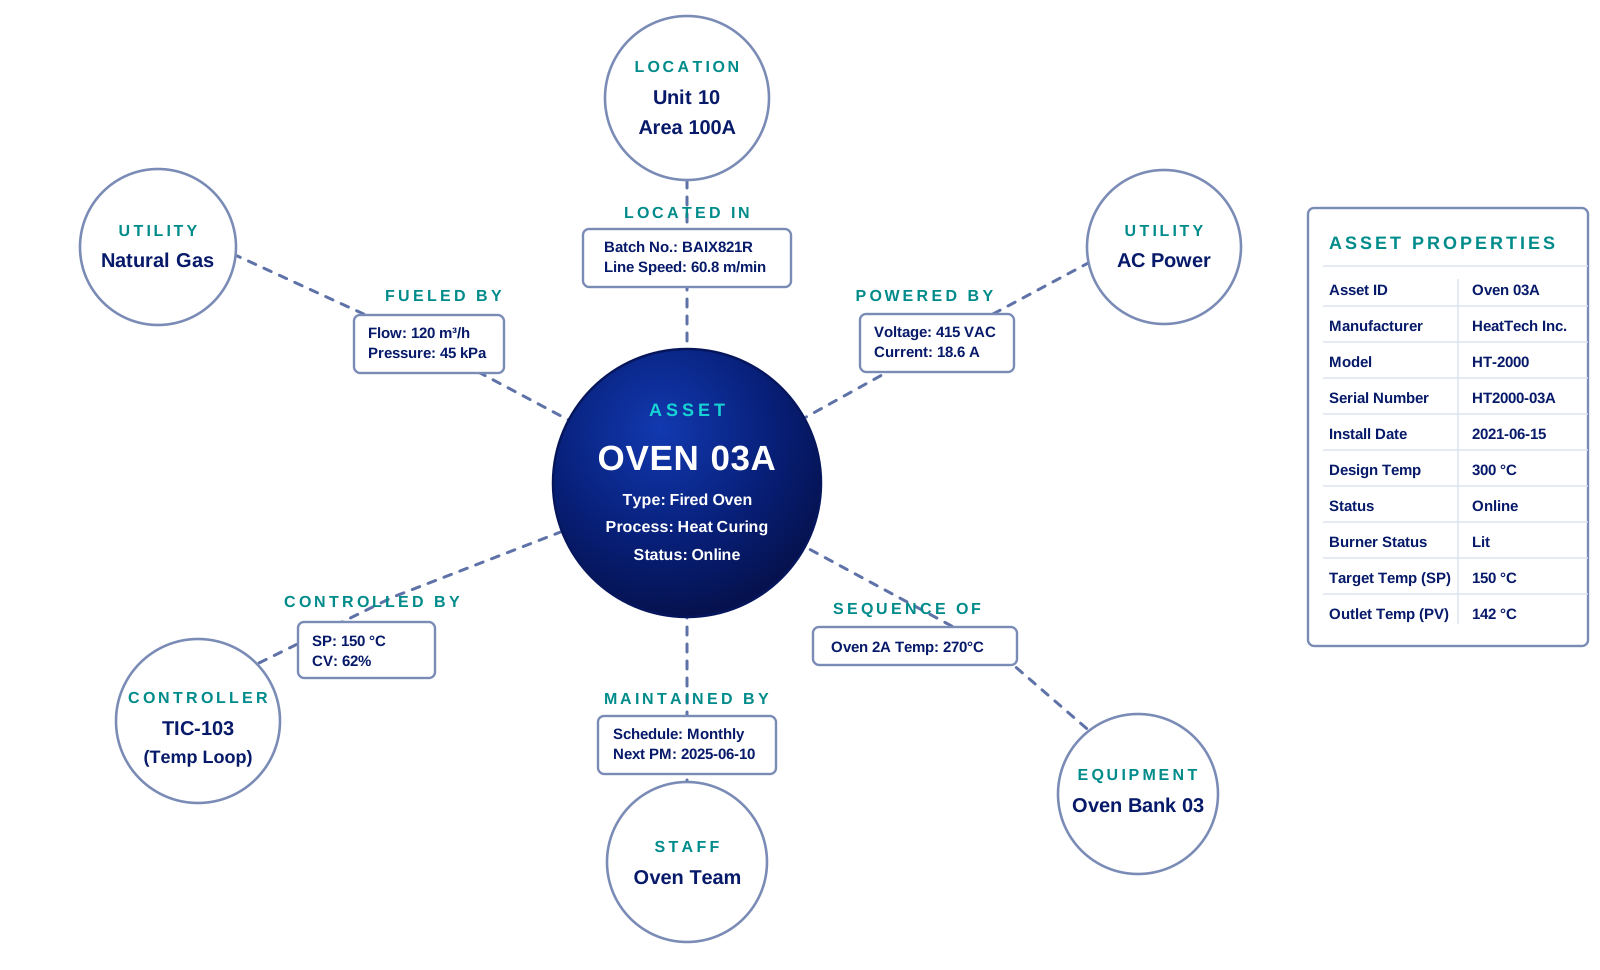
Most platforms organise industrial data into tags, tables and records. They make it findable, but they don’t explain how your operation actually works.
ARDI organises data around your real-world operations: assets, equipment, processes, locations and the relationships between them – a connected model often called a knowledge graph.
Once data sits inside this model, it stops being something you store and starts being something operators, engineers, supervisors and AI can all act on.
From a drop in temperature to its root cause.
Finding the cause usually means an engineer hunting through dashboards and correlating signals by hand. With your assets, processes and systems modelled, ARDI follows the relationships – and the cause surfaces itself.
Instead of searching across systems, you can answer practical operational questions:
What is the optimal line speed for a specific product batch?
How do we reduce energy use by preventing unnecessary over-heating in Oven 03A?
What is the root cause of Oven 03A temperature dropping?
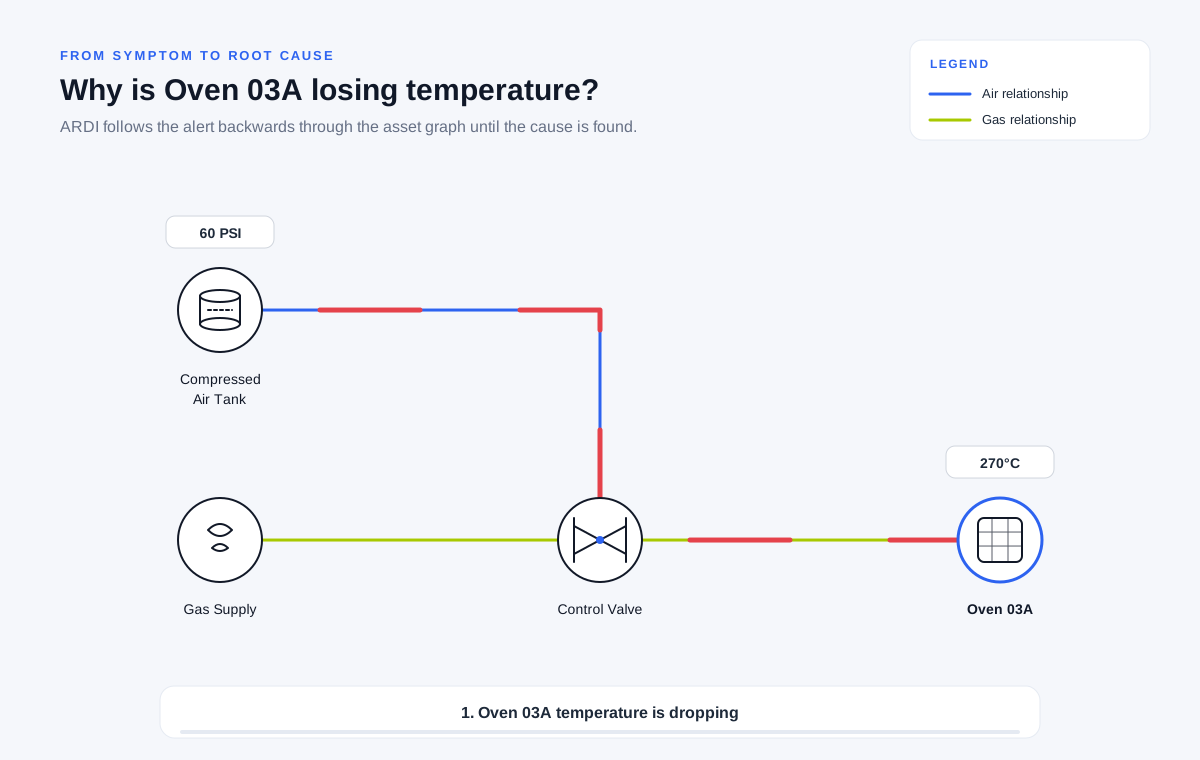
Demonstrating Q.03: ARDI traces an Oven 03A temperature drop upstream through the Control Valve to a Compressed Air Tank pressure loss – using only the relationships.
Rich context for AI – not just data.
ARDI doesn’t only give AI access to live data and history – it gives a deep understanding of how your process fits together and how equipment is interconnected. Through MCP, AI agents work with real assets, processes and dependencies, not raw tag lists.
Beyond chat and agents, ARDI also helps you train and deploy machine-learning models – for prediction, anomaly detection and optimisation – all grounded in the same operational context.
Live optimisation, built on relationships.
A manufacturer needed to increase production but couldn’t see how to get more line speed without breaking quality or safety. The data was there – drawings, instruments, schedules, automation – but how speed depended on each section was not. ARDI modelled how fast each section could safely run, then used the relationships between them to produce a live calculation of optimal speed and oven setpoints, fed straight into the control system – adapting as conditions change.
peak speed gains, no hardware change
live compensation when conditions change
bottlenecks now visualised and measurable
Bottlenecks only became visible once the line was modelled in sequence – and once visible, the same relationship model fed the live optimiser, the oven-zone reports and an adaptable reporting layer designed to survive upgrades.
What ARDI is, why it works, and how it gets delivered.
What is ARDI?
The relationship layer for your industrial data – what it does, what it doesn’t, and how it fits.
Optrix Consulting Services
Helping organisations navigate Industry 4.0, analytics and industrial AI.
Ready to make your industrial data work harder?
Try ARDI, book a demo, or talk to Optrix about a focused assessment for your site, line, plant or operation.