How ARDI Helps
Discover how ARDI can help with a range of issues you might be having.People In The Field
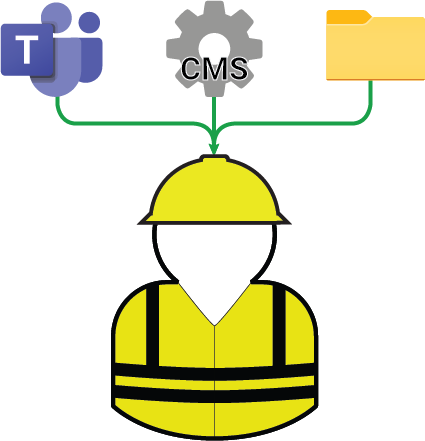
Scattered InformationARDI helps you consolidate each of your different sources of data in one place.
This doesn't just include your sensors - it can also include values from maintenance systems, staff scheduling and attendance systems, cloud services and simple Excel files.
It's also not just measurements - ARDI can deliver media, such as work instructions, videos, manuals and certificates
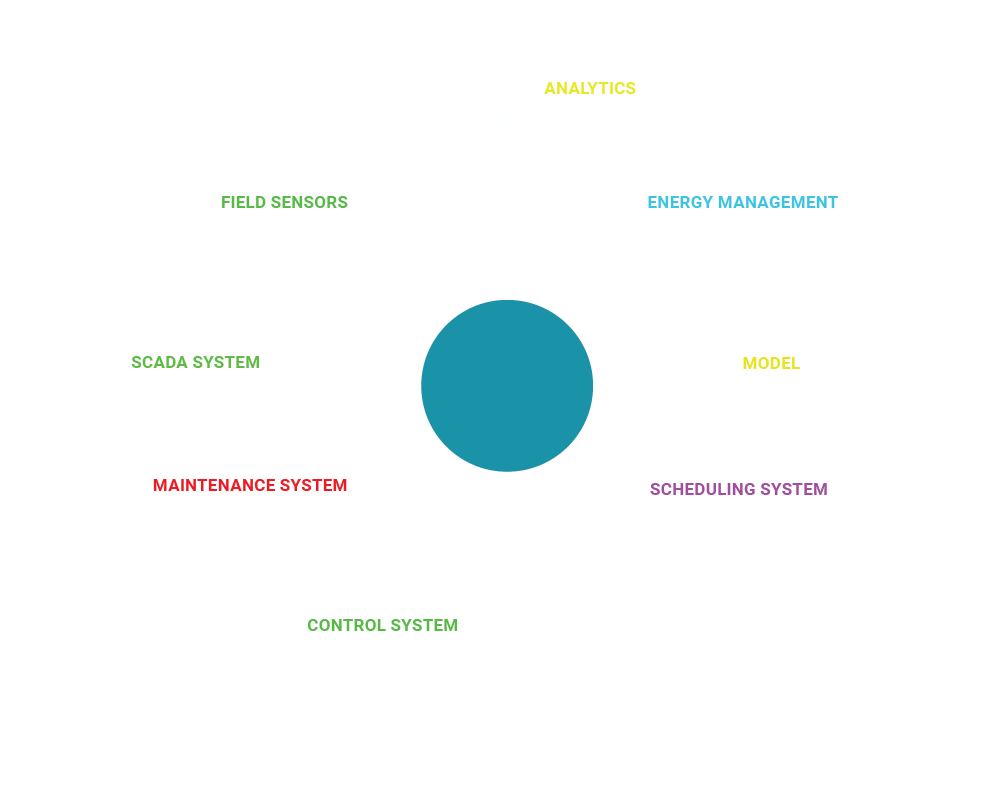
While a single point of data can be useful, you usually can only understand it's behaviour when you combine it with other, related information.
ARDI helps you organise your data into assets. These can be physical assets (pieces of equipment, tanks, conveyors etc.), or can also be logical assets, such as systems, areas, departments.
Even your human resources can be assets in ARDI
A single asset can contain information taken from a wide variety of sources, so you can have at-a-glance understanding of the state of a particular thing
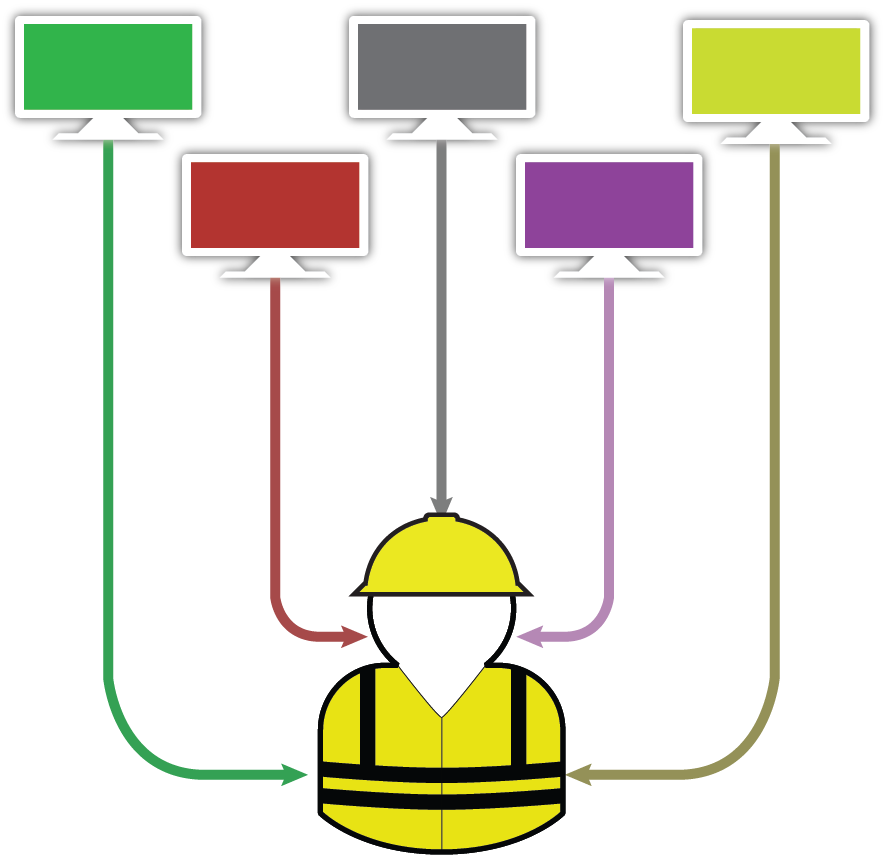
Many sources of information mean means that you have to access several different systems in order to get a full understanding of an assets status.
Not only is this very inefficient, but people also need to be trained in using each individual system and kept up-to-date and reminded of its use.
By centralising your information in one place, you instantly save a significant amount of time - rather than looking for information across several different systems, you only have to check one.
You also only need to be trained on that one system - reducing on-boarding times. And since ARDI helps hide the differences between sites, staff don't need to deal with differences in tools when moving from site-to-site.
ARDI doesn't replace the systems you're using - it just makes it easier to get information from them. You'll still use the same day-to-day tools the same way you're doing now.
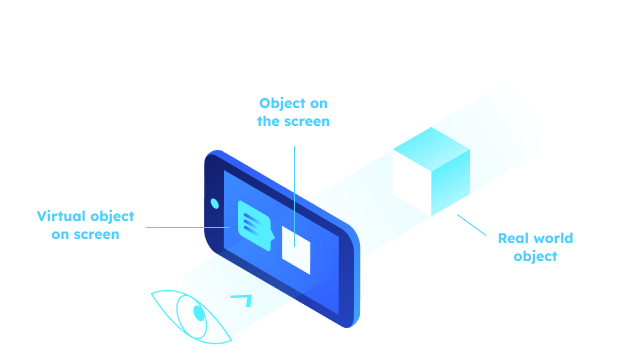
ARDI provides a range of options to access information in the field through smart devices such as mobile phones and tablets.
Using Augmented Reality or your existing markers (such as QR codes, barcodes or NFC tags), ARDI can deliver asset-specific information directly into your hands.
This doesn't just include manuals, specifications and access to web-enabled software packages (like work-order systems), but live data and trends.
Work sites often have a lot of repetition - the same type of sensor, valve or component will appear again-and-again across the site, making it difficult for people unfamiliar with your system to be sure exactly which asset they're looking at
Field-access tools like Augmented Reality allow you to confirm the identity of the equpment you're looking at using a smart device (such as mobile phone or tablet).
ARDI 360 is Street View* for your site.
It gives you a digital version of your site you can walk around to learn to navigate a facility, identify equipment remotely and plan work around permanent hazards
It can even guide you to connected equipment - ask where the drive for a motor is, and it will take you down the hall, up the stairs, into the motor control room and show you which cabinet the drive is in.
"Street View" is a Google trademark. ARDI-360 and Optrix have no official link to Street View or Google.
Your work instructions, procedures, calibration certificates and other documentation are often living documents - they change over time.
ARDI brings all of your different documentation storage systems - cloud, enterprise or even simply a folder on a shared drive - together in one place
It also always delivers the latest version directly from the source - so as soon as they're updated in your system, they're updated in ARDI.
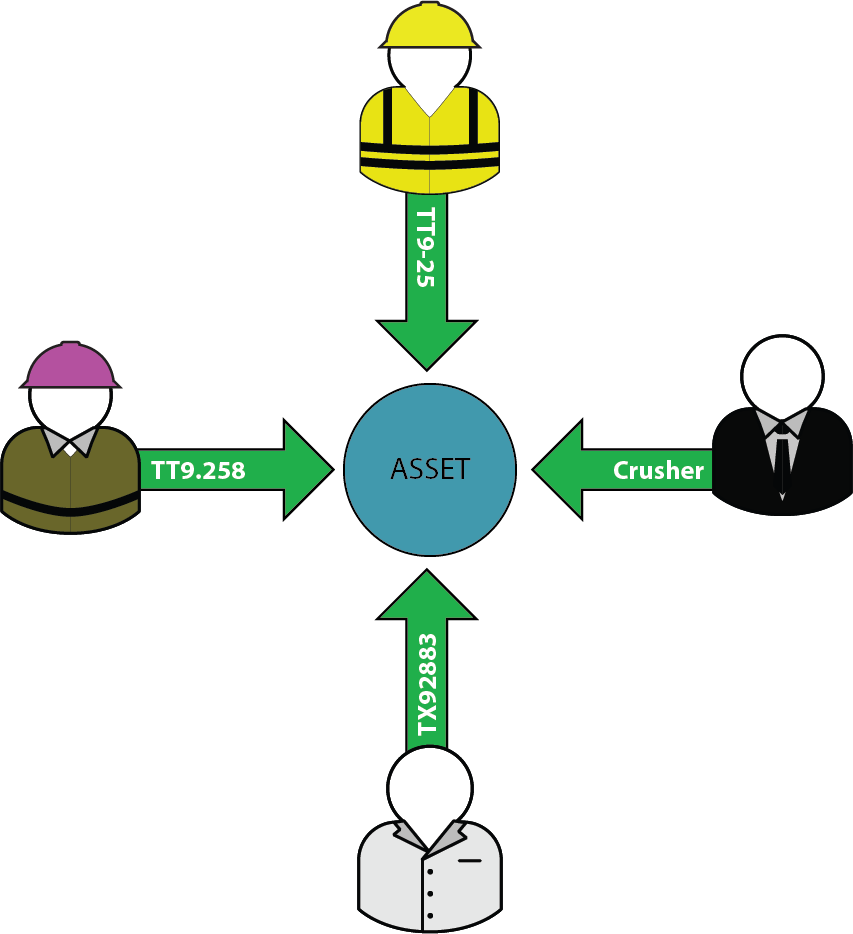
A single piece of equipment might be known under different names by various people and systems.
Your process people call it TT5-16, but your electrical people use a serial number, your maintenance people made a typo 3 years ago and they call it TT5.166, and your ERP system can't handle underscores and calls it TT516.
ARDI makes finding and communicating about assets simpler by combining all of the different identifiers in one place, and making the result human readable.
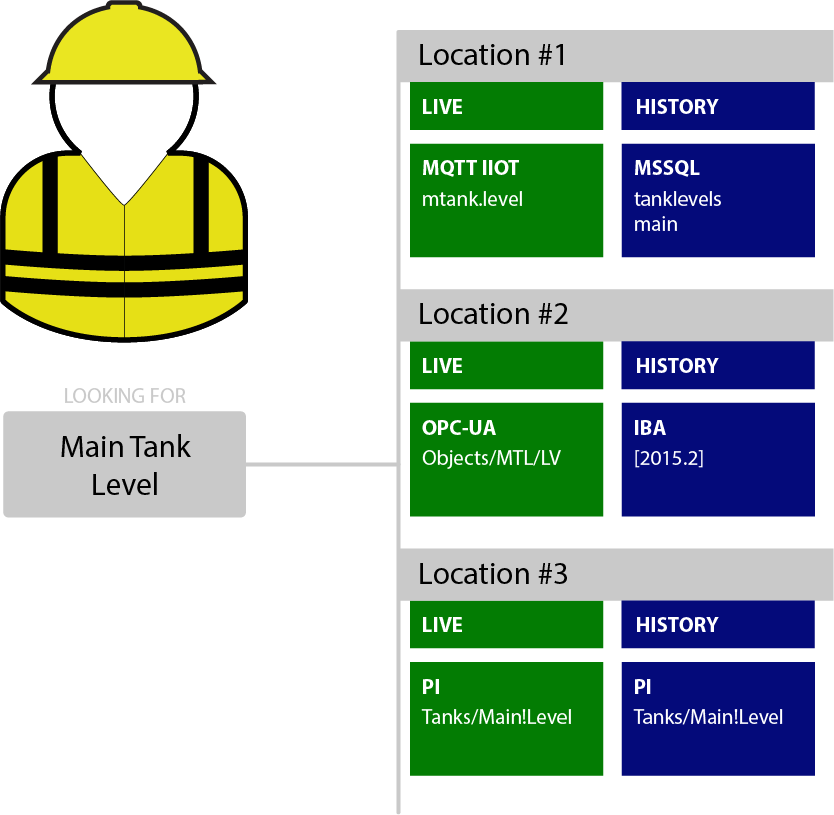
Sometimes, two sites that perform the same task can end up being radically different.
Changes in vendor, backend, design, construction or simply age can make things very different when you're trying to get the information you need to do your job.
When ARDI makes your data human readable, our assets also can help make accessing data consistent between sites.
When people are in an unfamiliar location, they know exactly where and how to find the information they need to get the job done.
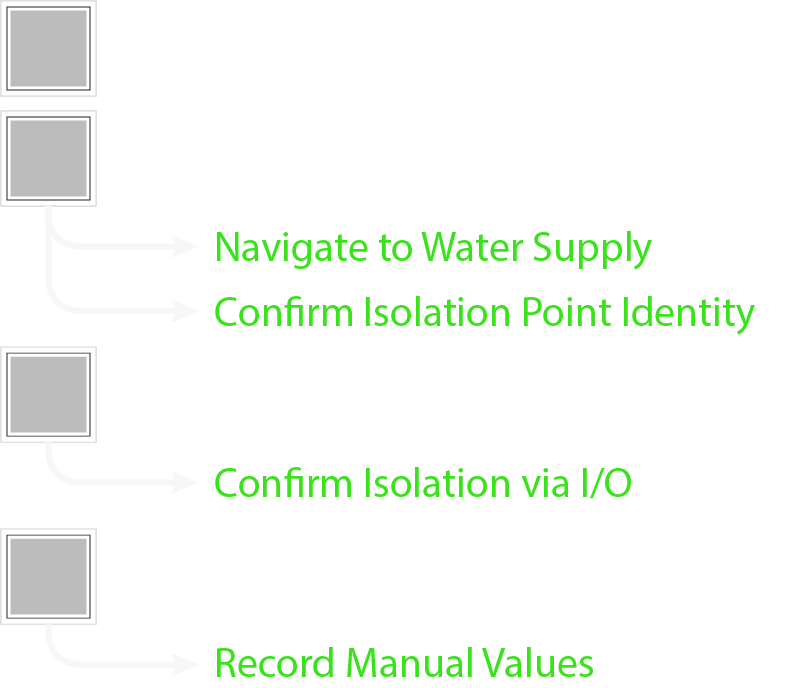
No matter how automated your process is, there's always the need for manual tasks and inspections on-site. There's a need to ensure that these tasks are done on time, according to procedures and safely
The ARDI checklist and checkmate addons allow you to make interactive, web-based checklists that guide your people through processes.
These checklists work using ARDI data - showing you where to find isolation points, confirming that you've completed tasks, and capturing responses.
By confirming actions against I/O and recording values being read in the SCADA system, you can help ensure that procedures were followed and all work is compliant with any regulations, policies and procedures you need to follow.
Operations
Lack of Process Awareness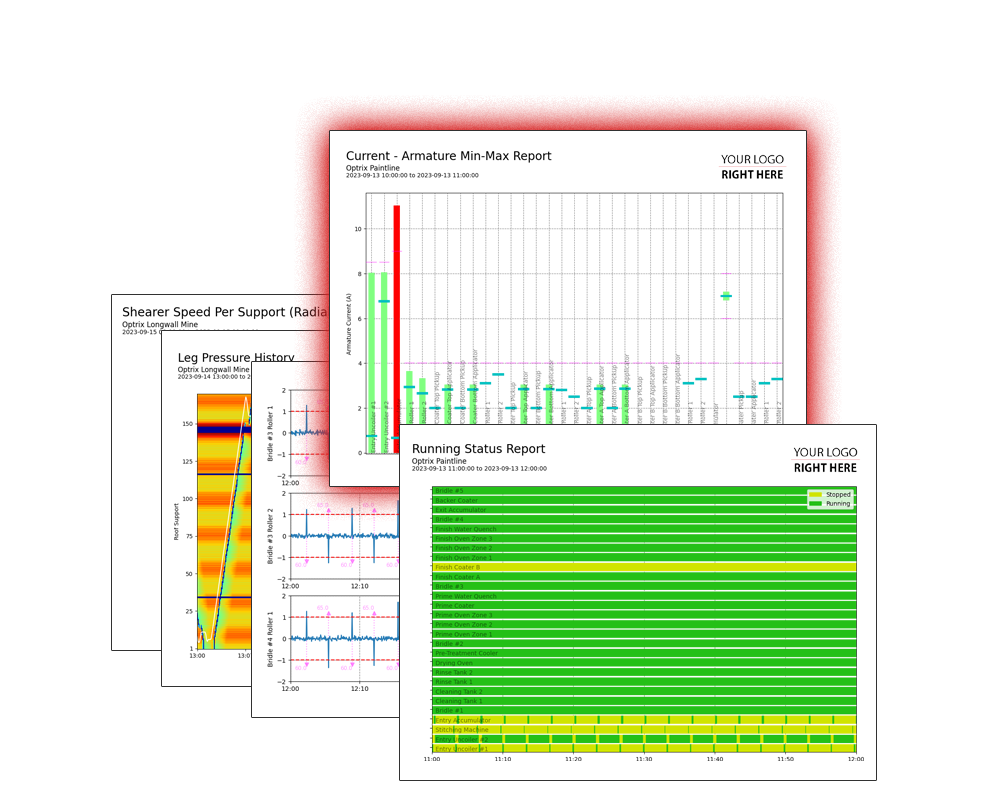
ARDI is often used to both detect and explain process stopages.
This lets people understand how much downtime a process experiences, when those downtimes happen, and why - all critical steps in making your process more efficient, economical and environmentally friendly.
If and when down-time happens, it's important to be able to quickly and efficiently find the cause of the issue so that corrective actions can be taken.
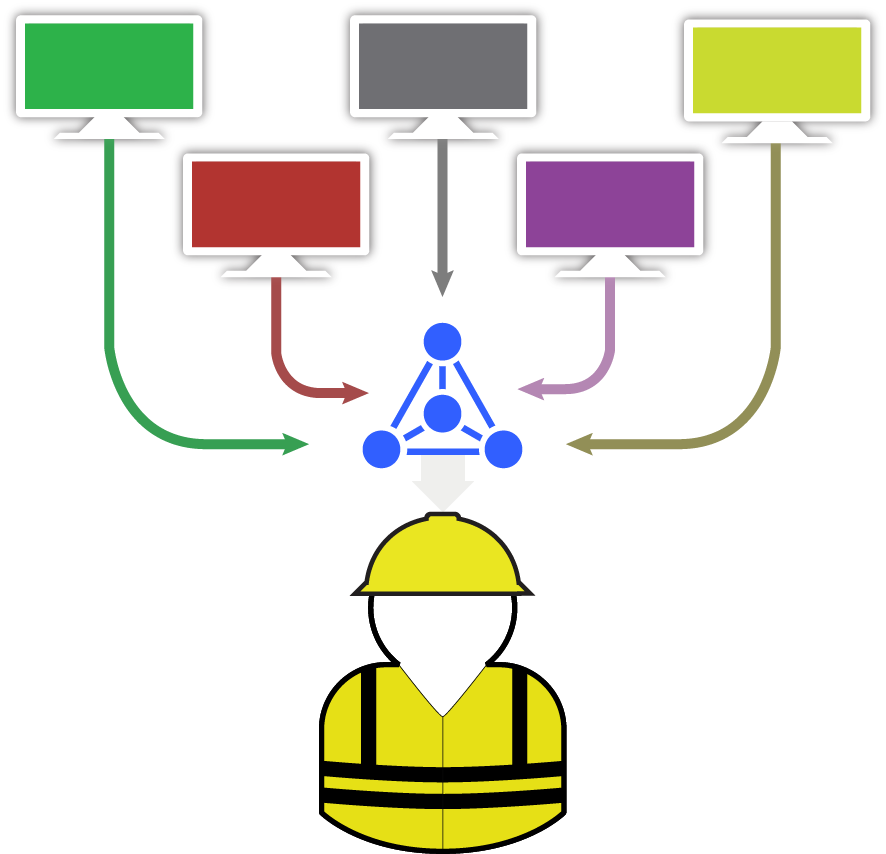
ARDI not only provides a range of tools that can help you use live and recent data to discover the cause of a fault, you can also create AI-powered alerts to help perform this analysys for you.
This can radically reduce the amount of time it takes to resolve issues on-site, meaning you're back up-and-running faster
Control issues have a major impact on quality and efficiency, but it's surpring how often they're ignored
ARDI is not only a great platform for creating live analytics and ongoing reports of your control quality, but it can be used to detect, alert and even predict control issues.
It can also be used for a number of other types of anomaly detection - spotting problems you haven't considered.
Sites often have a range of KPIs and targets, but it's not always easy to tell how close you are to meeting them - and the data you have isn't always trustworthy.
ARDI uses your most accurate data to give you the plain truth about your equipment and how it's being used, allowing you to get accurate KPIs and measurements of process performance.
By combining production schedules, roster and maintenance information, you can also correct your targets for unanticipated events, scheduled down-times and issues beyond the control of your team.
While some issues are sudden, there are others that you can predict - warning your people before they stop production or cause issues.
Using our combined data, our ability to work with information over different time-scales, and our intimate knowledge of the structure of your plant, ARDI can be used as a predictive tool.
Using mathematical or machine-learning models, ARDI can notify your people when issues are likely to happen - such as temperatures rising too high, values being out-of-balance, or quality becoming poor.
People who have scheduled reports often have to flip through the same information day-after-day. Not only is it boring, it causes report fatigue - you stop really looking at the reports.
ARDIs reporting engine can help you combat report fatigue by training an AI to determine if the reports are unusual.
This way, you have instant access to all of the reports showing unusual or unexpected values - those that are different from the day-to-day reports you're tired of seeing.
ARDI makes a very useful tool for remotely supporting staff.
Using 360, it gives remote users the ability to understand what the person in the field is seeing, and help guide people to the areas they need to be.
It also allows remote experts to understand the specifics of a site. While subject-matter experts might understand the overall structure of a particular location, there are often unique differences from site-to-site. ARDI can help an expert get general information, and also guide them through the detail of the process.
There are so many data points in modern systems that it's often impossible to tell which data points are related to a single piece of equipment.
ARDI helps bring some order to the chaos by organising your data points into assets.
Engineers
Lack of Process KnowledgeARDI captures types of information that many platforms don't include - such as how assets are connected, where they are located, what they look like and what they are
This allows those unfamilar with the details of a site to understand how each of your assets work together to make a complete system, and what the down-stream effects of their actions might be.
ARDI's human-readable data also means that experts in other fields - such as AI and analytics - can easily access information without needing to understand the details of a site
There are a lot of potential causes of poor quality from a system.
By bringing together information from many systems and knowledge domains, ARDI gives you a platform you can use to find root causes and common elements that lead to defects and quality issues.
You can synchronise your machine sensors with log files, manual inspections, your quality system and production schedules to analyse and then build detectors and alerts for issues that cause poor quality.
Assets aren't just limited to being equipment. These can be physical assets (pieces of equipment, tanks, conveyors etc.), or can also be logical assets, such as systems, areas, departments.
Even your human resources can be assets in ARDI
If it's something you might want to talk about, view or report on, it can be an asset in ARDI.
People often only look at a limited set of HMI screens, dashboards and reports. These have all been pre-made by other people, and only offer limited windows into what is actually happening.
There are issues, opportunities and value hiding in these places where people simply can't easily see
ARDI and its clients are designed to give the user the ability to choose what they are looking at, how they see it, and when the data is from - so they can turn your unseen, unused data into valuable insight.
Sites and processes can be very complicated - understanding what happens when you isolate a valve or turn off power to a device can require information from many different diagrams.
Not only does researching these connections take time, the diagrams explaining them are usually stored in filing cabinets back in the control room - not in the field where they're needed.
ARDI relationships allow you to see the connections between assets - to trace power down-stream from a meter to the machine it delivers energy to, or to follow the flow of air back up to the compressor.
They help your people - particularly those less familiar with your system - understand how your equipment fits together to form a process, and what the results of their actions might be.
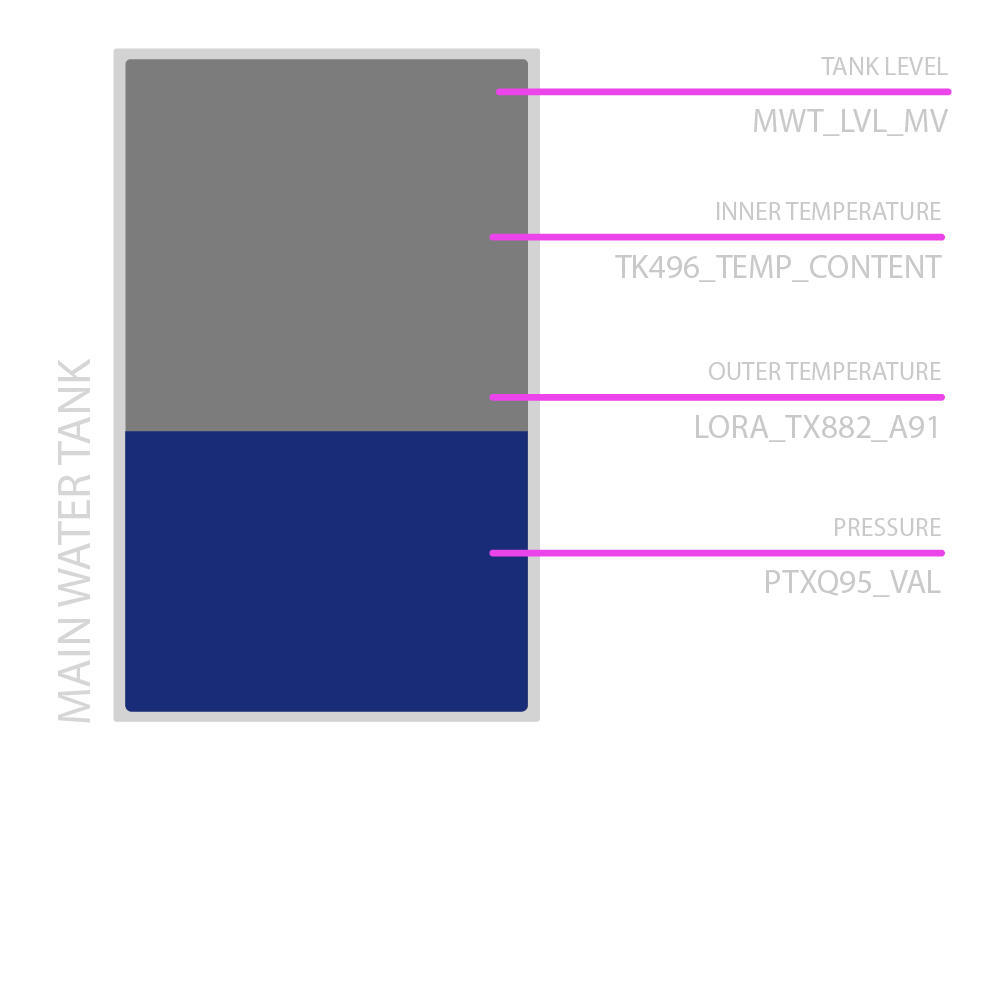
The names of your data points can be beautifully organised. But most - and particularly those that have been around a while - can be utter chaos.
Automatic names, typos, rushed work and changing naming standards usually leave many industrial historians a mess of points. Figuring out what any of them mean can be extremely difficult.
ARDI is designed to help make your system human-readable, not just for your engineers, but for people across the organisation. Instead of looking up 'QR9645_RT', they look up 'Main Tank Reference Temperature'.
Along with organising points of data into assets, this helps users with very different types of expertise access your consolidated data.