
Connect, contextualise, deliver, apply.
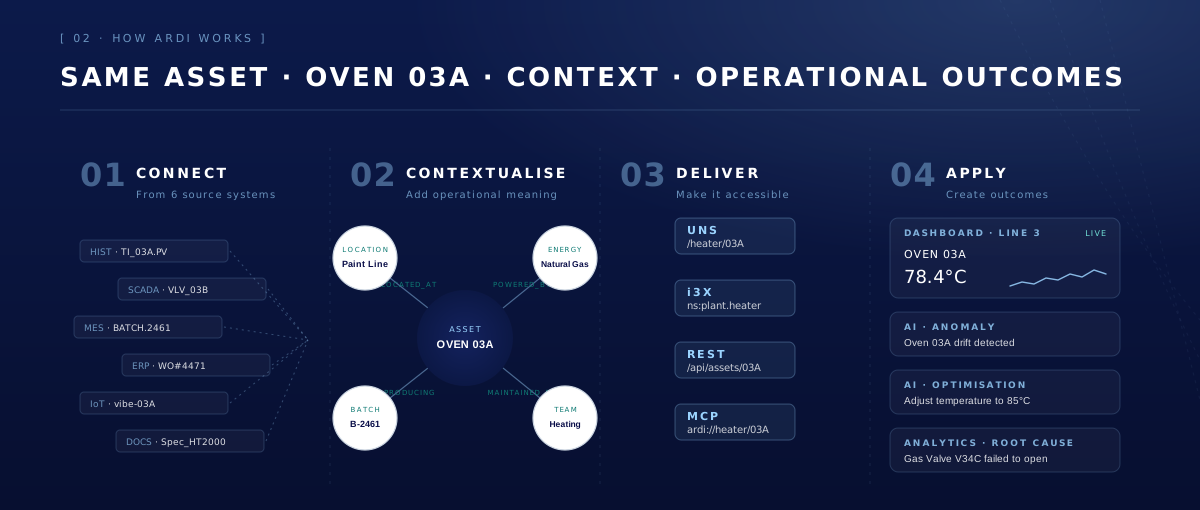
ARDI connects to your source systems, models the relationships that explain how your operation works, and delivers that data through open industrial standards, without replacing your existing systems.
ARDI also includes a set of integrated tools that put that context to work – dashboards, 360°, diagnostics, analytics and AI – all built on the same operational model.
Access existing data
Reach data where it lives – historians, SCADA, MES, ERP, IoT and files. Live, historical and business data, served as one – with source systems left in place.
Model relationships
Define how assets, equipment, processes and systems actually relate – capturing the sequence, flow and dependencies that tags and hierarchies miss.
Make it accessible
Access through open industrial standards such as i3X, REST, UNS, MQTT, OPC UA and MCP – for APIs, applications, dashboards and AI agents.
Create outcomes
Use ARDI’s tools – visualisations, analytics, AI, optimisation, diagnostics, reports and decision support – running alongside the process.
Turn connected data into practical solutions.
With relationships modelled, you can work across systems, assets and processes – not within them.
Your data stops being a list of tag values and becomes a connected picture of your operation – one you can ask real questions of, end to end.
See what’s happening
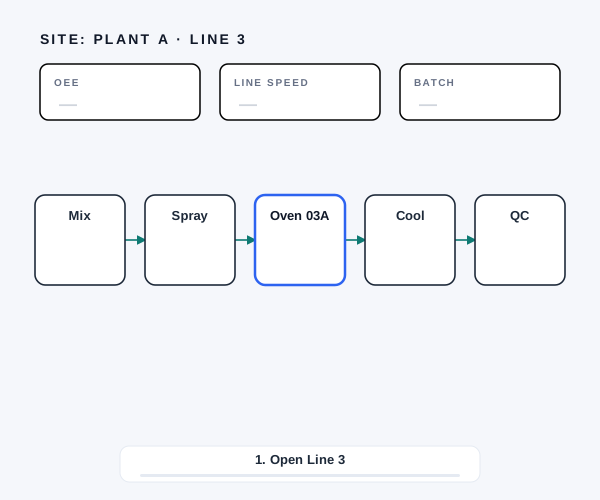
Get a clear view of performance across assets, processes and sites – combining live, historical and business data into a single operational picture, connected by the relationships that explain how it fits together.
Understand why it’s happening
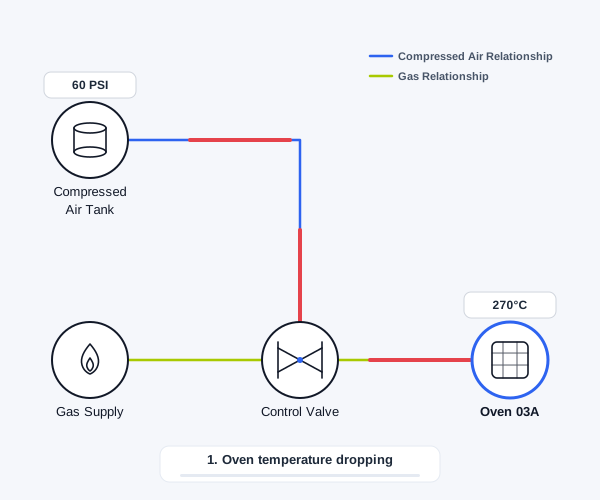
Follow relationships between equipment, processes and events to trace issues across systems and identify root causes faster.
Improve how it happens
Identify inefficiencies and optimise performance live – from throughput and quality to energy and utilisation – with optimisations running alongside the process.
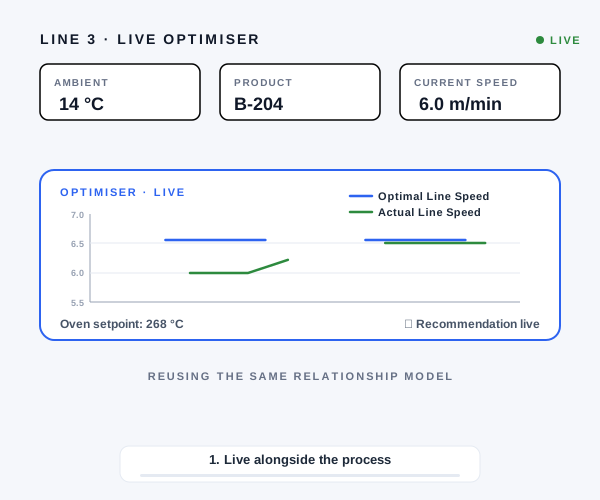
Act before it happens
Detect patterns, anticipate issues and act earlier – backed by relationships that show how a change in one place affects another, before it becomes a problem somewhere else.
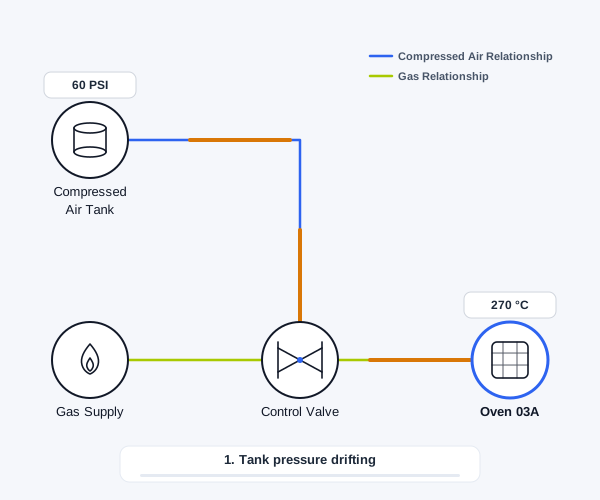
ARDI’s view of your operations.
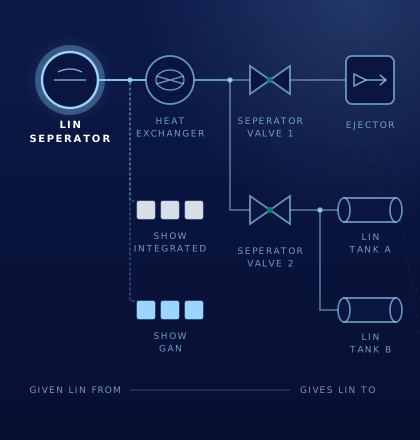
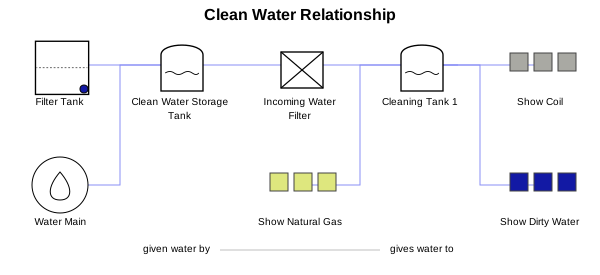
Open any asset in ARDI and you see how it connects to the rest. Each connection is labelled by what it actually means – “given water by”, “gives water to”, “contains”, “powered by” – so a question about one asset can follow those relationships wherever they lead, across systems and processes.
What makes ARDI different?
Four principles shape how ARDI handles industrial data – and why it works differently from other industrial data platforms.

Data stays where it is
ARDI reads from source systems and delivers data when it is needed, reducing duplication, migration effort and the need to replace existing systems.

Context comes first
ARDI does more than connect data, it understands how operations fit together. It models assets, equipment, sensors and processes, along with their relationships, forming a knowledge graph that gives data meaning.

Open industrial standards
ARDI provides a consistent access layer aligned to modern interoperability patterns including i3X, REST, MQTT, OPC UA and MCP – enabling systems, applications and AI agents to access industrial data in a unified, predictable way.

AI-ready industrial data
ARDI gives AI the operational context it needs: assets, relationships, live data, history and meaning. This supports more reliable AI agents, chat tools and machine learning models that can work with industrial data in context.
Integrated tools built on ARDI
ARDI includes a set of tools designed to deliver these capabilities in practice – all built on the same connected and contextualised data foundation.

Dashboards and reporting
Create real-time and historical views that combine data from multiple systems – giving teams a clear picture of performance across assets, processes and sites.

Visual environments and 360° access
Extend data into visual contexts, such as interactive 360° environments, where users can explore assets and access live information directly within the physical view of the operation.

Diagnostic and analysis tools
Investigate issues faster by following relationships between equipment, processes and events – reducing time to understand and resolve problems.

Analytics and optimisation
Identify inefficiencies, uncover patterns and improve performance – from throughput and quality to energy and utilisation.
AI-driven insights
Apply machine learning and AI to detect anomalies, predict outcomes and support better decision-making using data that already has meaning and context.

Operational tools and workflows
Configure tools and workflows that support day-to-day operations – connecting data, people and processes in a way that fits how your organisation works.
Why ARDI works, what’s inside it, and how it gets delivered.
ARDI Components
Inside ARDI’s architecture – the Core that holds context and the tools that turn it into practical capabilities.
See what your industrial data could actually do.
Start with a small use case, a practical discussion, or a low-risk Proof of Value. ARDI helps you move from fragmented data to operational intelligence.