What Is The Infographics Addon?
The Infographics addon is designed to help you build and distribute displays that are powered by live and historical data.
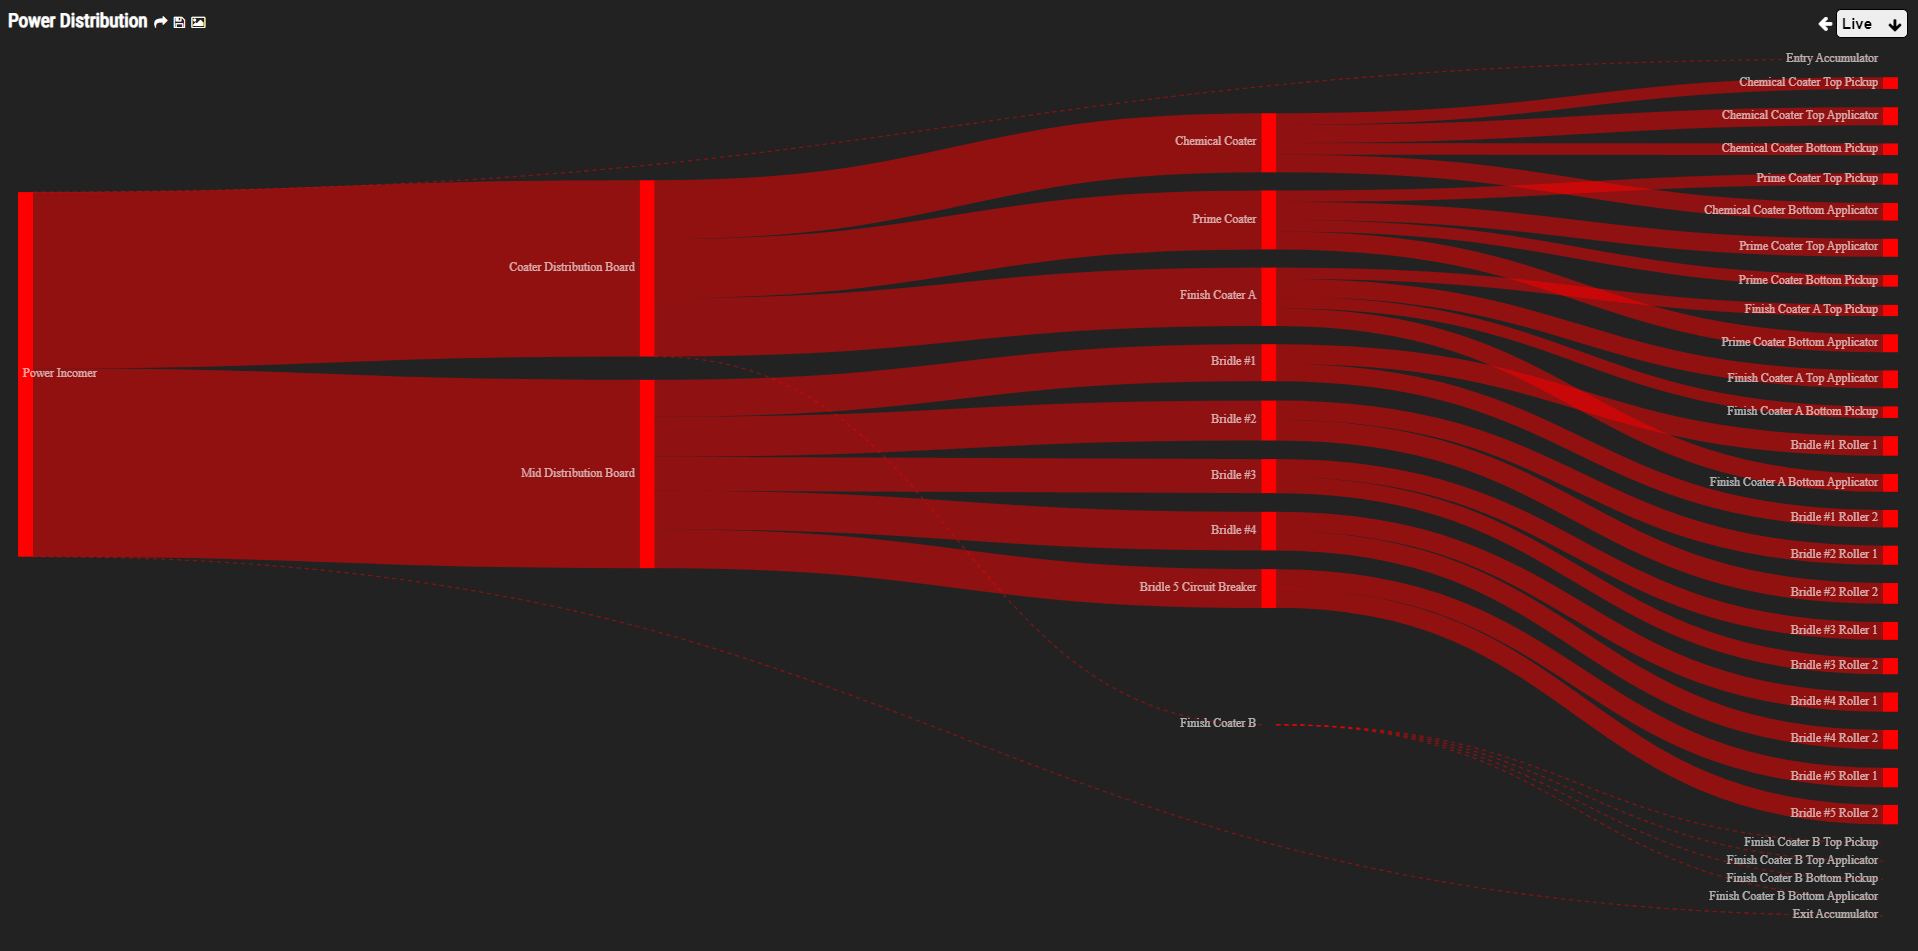
While the Reports addon focuses on static, longer-term data – such as daily, weekly or monthly figures – Infographics are interactive, web-based displays that no only respond to live data, but often respond to the user too.
You can use Infographics to create live status displays, show live values on maps, create interactive 3D ribbon charts, show the real world position of articulated machines, and much more.
In fact – with the many tools and libraries available – your imagination is the limit. You have the flexibility to build visualisations that have the look, feel and logic you need.
Features
Along with providing Javascript frameworks to quickly and easily make the infographics themselves, the system…
- Provides a easy-to-use UI to find and generate displays,
- Creates playlists of automatically-switching displays that can run on unattended displays.
- Offers optional Time-Travel on live displays, allowing you to move back in time and play back past events at high-speed or in slow motion,
- Offers hybrid reporting, pre-loading a display with historical data then subscribing to live information to keep it up-to-date,
- Create interactive elements with tooltips and easy access to ARDI dashboards,
- Integrate with a range of visualisation libraries such as d3.js, threed.js and many more.
Limited Addon
This is a limited addon.
This means that users with a Starter license or those who don’t take the Unlimited Reports option for their ARDI license will be limited to 10x displays total.
You still have access to the full set of infographic functionality – the only limitation that applies is the total number of displays available at any one time.