Timeline
A powerful tool to help with difficult root-cause analysis.
Timeline is a web-based ARDI tool targeted at engineers and process improvement specialists who need to find the cause of complex issues on-site.
Timeline is used to scan parts of your system – or even your entire system – to search for statistically significant events across a chosen period of time.
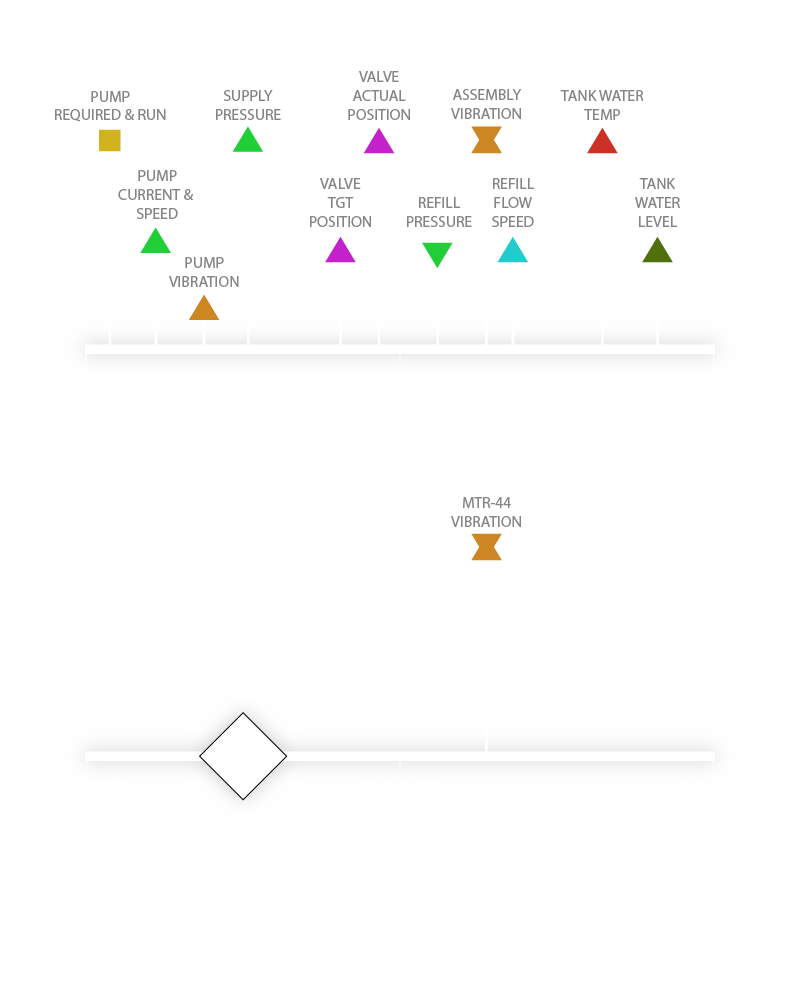
Timeline then provides both logs and an interactive visual display of all of the events during the chosen time-window, including…
Importantly, it shows these across all of your signals, so rather than looking at trend-lines for a few points, you can see significant events across hundreds or even thousands of channels at once.
But not every change in state across your system is bad – in fact, most of them are critical to your process running.
Luckily, trigger gives you the option of adding event signatures – combinations of events that indicate routine operations on your site.
When Timeline spots these combinations of events, it gathers them all into a single point. This not only helps non-experts understand what is happening in your system, but it also hides most of your normal day-to-day operations – leaving mostly the abnormal events on the chart.
