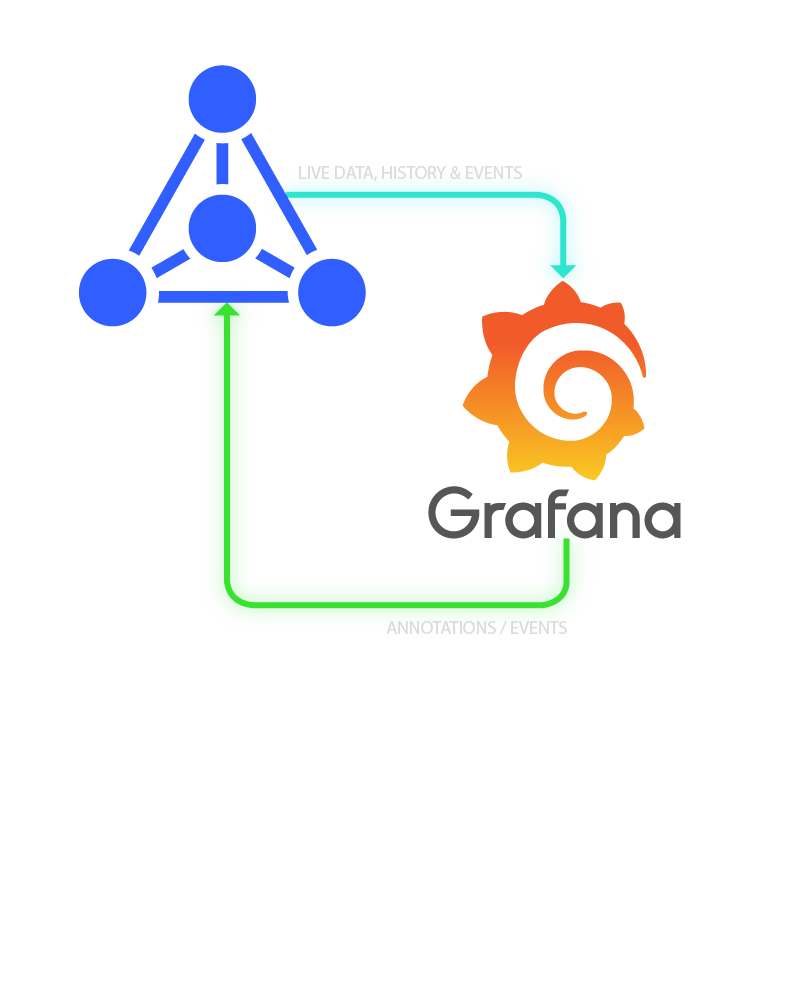
What Is The Grafana Addon?
The Grafana addon makes your consolidated ARDI data available in the Grafana observability platform.
Grafana is a great tool for making simple web-based dashboards that can be shared across the organisation. Grafana visualisations are easy to create and deploy, making it a good fit for your simpler forms of display.
Advantages
There are several advantages to using ARDI for Grafana displays…
Easy To Find Data
ARDIs assets and properties are designed to be human readable. We’ve often had hour-long discussions with users who are trying to find the right point name for a single piece of information, but with ARDI it’s simply “Main Tank Level” – easy for engineers, operators and even non-technical staff to find.
Abstractions Between Sites
If sites operate in a similar way but have radically different back-ends (ie. different SCADA systems, historians or equipment vendors), ARDI can help make the same Grafana display work across multiple sites.
Dynamic Displays
The ARDI Grafana plugin allows you to request queries as well as requests for individual channels. This lets you build dashboards that adapt when processes change, such as when new sensors or equipment is added to site or old equipment decommissioned. If built using queries, ARDI-powered visualisations can effectively update themselves.
