Using ARDI, you can use open-source tools to create animated video overlays that smoothly respond to changes in live data, allowing you to mix real-world visuals and real-world data in real-time.
How does it work?
We use Open Broadcaster Software (OBS) to mix your live data and your video stream.
OBS is one of the most popular tools for people who live-stream. It lets you add layers of content onto your video stream, which can include video feeds from cameras, or screen-casts of running applications.
As well as video content, OBS also allows you to add web content to your video. Using ARDIs web-based digital signage tools, we can use this to create overlays that respond to live data.
Step 1 – Install OBS Studio
Firstly, you’ll need to install OBS Studio (not the simpler StreamLabs OBS). You might also want to grab the RTSP Server plugin.
Once you’ve opened the app, you can add a Source using the Sources panel at the bottom of the screen.
Sources can include….
- Sharing a screen on your device, such as an HMI, Grafana Dashboard or security camera application (Display Capture)
- Capturing video from a webcam or other camera attached to the computer (Video Capture Device)
- Displaying a feed from a network camera, security camera or security camera package (Media Stream to a remote URL).
- Looping a video with a background or marketing content (Media Stream to a local video).
Step 2 – Create a Web Page with your Content
Next, you can use our Javascript API to build some content that responds to live data. For example, below we have the code to make a bar-graph that moves up and down with the engine temperature of our vehicle. You’ll need some experience with HTML or Javascript for this step.
You’ll need to….
- Create a new, empty HTML file
- Build the objects you’d like to overlay over your video (bar charts, gauges, text notifications etc.)
- Use the HMI.js library (included with your ARDI installation) to make these elements respond to live data.
- Save the HTML file on your PC and test them in a browser.
Below is an example of the HTML to create a bar-chart on the right-hand side of the screen…
<html>
	<head>
		<title>General Overlay</title>
		<script src="/plugins/optrix/hmi.js"></script>
		<script src="/plugins/jquery/jquery.min.js"></script>
	</head>
	<body>
		<svg style="width: 100%; height: 100%;" viewBox="0 0 1024 768">
			<text x="900" y="680" fill="white" text-anchor="middle">Engine Temp</text>
			<text x="900" y="720" fill="white" style="font-size: 40px; text-anchor: middle;" id="engtemp">22.5 C</text>
			<rect x="875" y="30" height="600" width="50" fill="silver"/>
			<rect x="875" y="30" height="600" width="50" fill="green" id="engbar"/>
		</svg>

	</body>
</html>
And below is the matching Javascript to make the green bar-chart move up and down in response to incoming data and change colour from blue, to green, and finally to red as the temperature moves.
<script>

var Connection = new HMIPanel();
Connection.Subscribe("17:23:measurement",function (dta) {
	$('#engtemp').html(parseFloat(dta).toFixed(1) + "C");
	var perc = dta / 500;
	var newht = 600 * perc;
	$('#engbar').attr("y",30 + (600 - newht)).attr("height",newht);
	$('#engbar').attr("fill",CalcGradientColourRGB(perc,[[0,[0,0,255]],[0.5,[0,255,0]],[0.65,[128,255,128]],[0.8,[0,255,0]],[1,[255,0,0]]]));

});

Connection.Connect("myardiserver/s/myardisite");
</script>
Step 3 – Add the Source to OBS
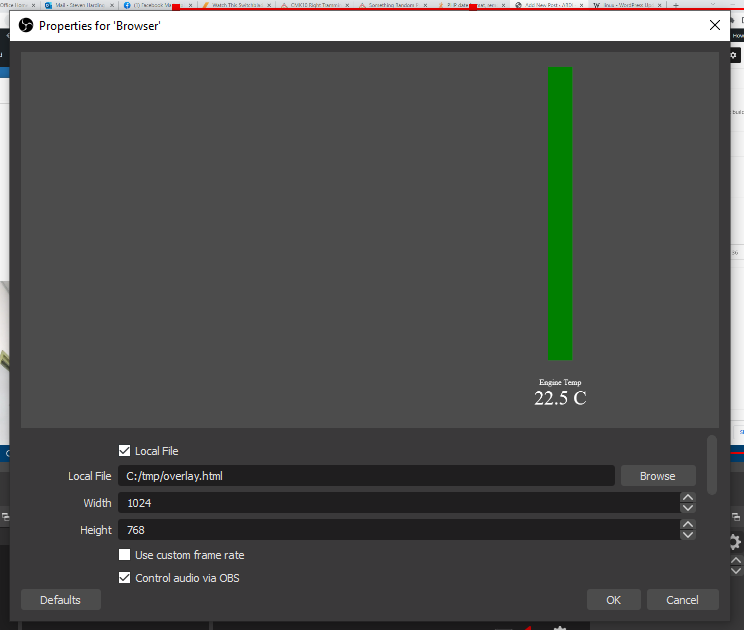
In OBS Studio, add a new Browser source, and point it towards the file you created in the step above. You might need to adjust the width and height settings to match your layout.
You’ll see a preview of your chart – hit OK once it appears.
Then you’ll have a video that includes live data overlays – you can make them as simple or as complicated as you’d like.
Step 4 – What Next?
The final question is “What do I do with my stream?”
If you’re running security camera software like Milestone X-Protect, you can use the RTSP Server plugin we installed earlier to send the stream right back to Milestone, so it can be recorded and sent out to other people.
You can directly access your stream from other computers in your network by using video playback software like VLC Media Player
You can also record footage, or stream it to any service that OBS supports.
What more can I do?
If you’ve got mobile equipment or would like to have your cameras automatically switch to view activity around your plant, you can also switch between cameras with live ARDI data.
With ARDI, you can do almost anything with your live and historical data. If you’d like to find out more, please contact us.
