What Is Capture?
Capture is a tool to extract and use data about time frames. It automatically captures key details about defined periods of time, combining and synchronising data scattered across many different sources and recording the information in a single record.
We use the generic term ‘time frame’, but these can represent anything with a defined beginning and end, such as…
- Hours or Days (for KPIs),
- Shifts,
- Events,
- Batches,
- Downtimes,
- Trips/Journeys/Passes etc.
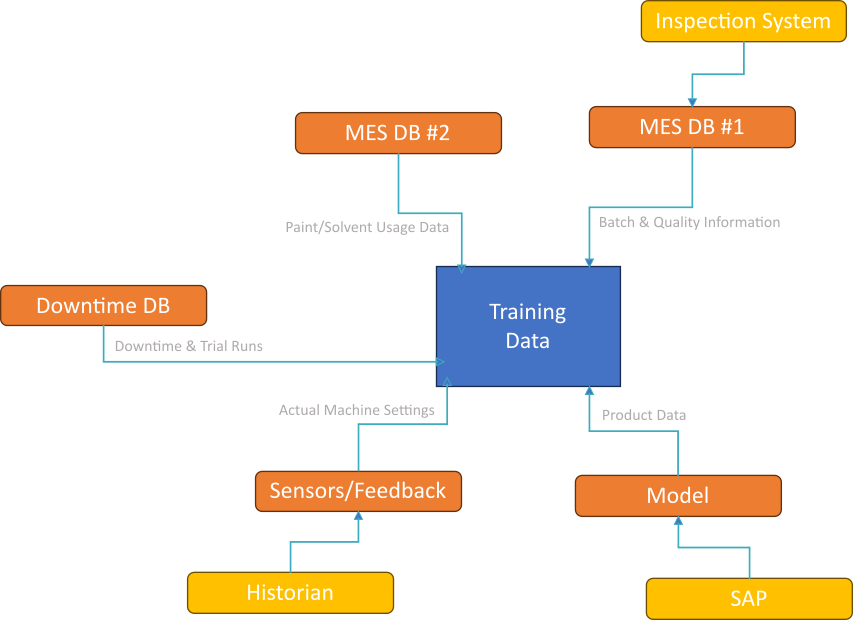
It lets you combine information that would normally be scattered across sensors, downtime reporting, inspections, production scheduling and APIs and boil them down to a single recorded, re-usable summary.
The system takes care of not only finding and extracting these, but also records the results and provides a simple API and interactive user interface to be able to access, explore and clean your resulting data.
Working With Data
We don’t stop at just collecting the data.
Aside from the API and basic search, we offer several other tools that are targeted at specific industry needs.
Back-Generation
If your data sources were unavailable or your logic or data needs change, you can go back and rebuild missing or outdated records automatically. This means you don’t have to wait for new data to start doing analytics or build AI models – you can build your data up from your existing information.
Modelling
You can download not only your full database of information, but also the framework you need to use it to build and deploy a machine learning AI with it.
This means you can build an AI that can predict defects before they happen or can optimise your settings and setpoints before you begin production.
Fuzzy Search
In applications where you need to set up your process for a range of different conditions (a common problem in manufacturing lines that run several different products), Fuzzy Search looks through all of your captured data looking for the closest match – letting you adjust your priorities so that you’re handed the best available recipe to use in production.
Bayesian Optimisation
If you’re running experiments or trialling a new process, Bayesian Optimisation takes all of your previous experience and uses it to try to find the ideal setup for your next test, suggesting settings and setpoints that should bring you closer to the ideal run.
Outlier Detection
We have a number of tools to visualise your data, some of which are designed specifically to help you spot outliers or oddities in your data, where they can be cleaned up.
Correction
As well as being able to hide problematic records (real-world systems always have small hitches and issues – we allow you to hide records that are ‘bad’ and shouldn’t be used), you can make updates to fix issues. These updates are able to survive regeneration – if you need to re-build a record for any reason, the manual changes you made will be re-applied and not lost. If you remove your manual changes, the most recent automatically-gathered value will be restored.