Distribution
Understand how data is distributed with a range of pivot options.
Distribution is an ARDI tool that lets you pivot your data in a large number of ways through an easy web-based interface.
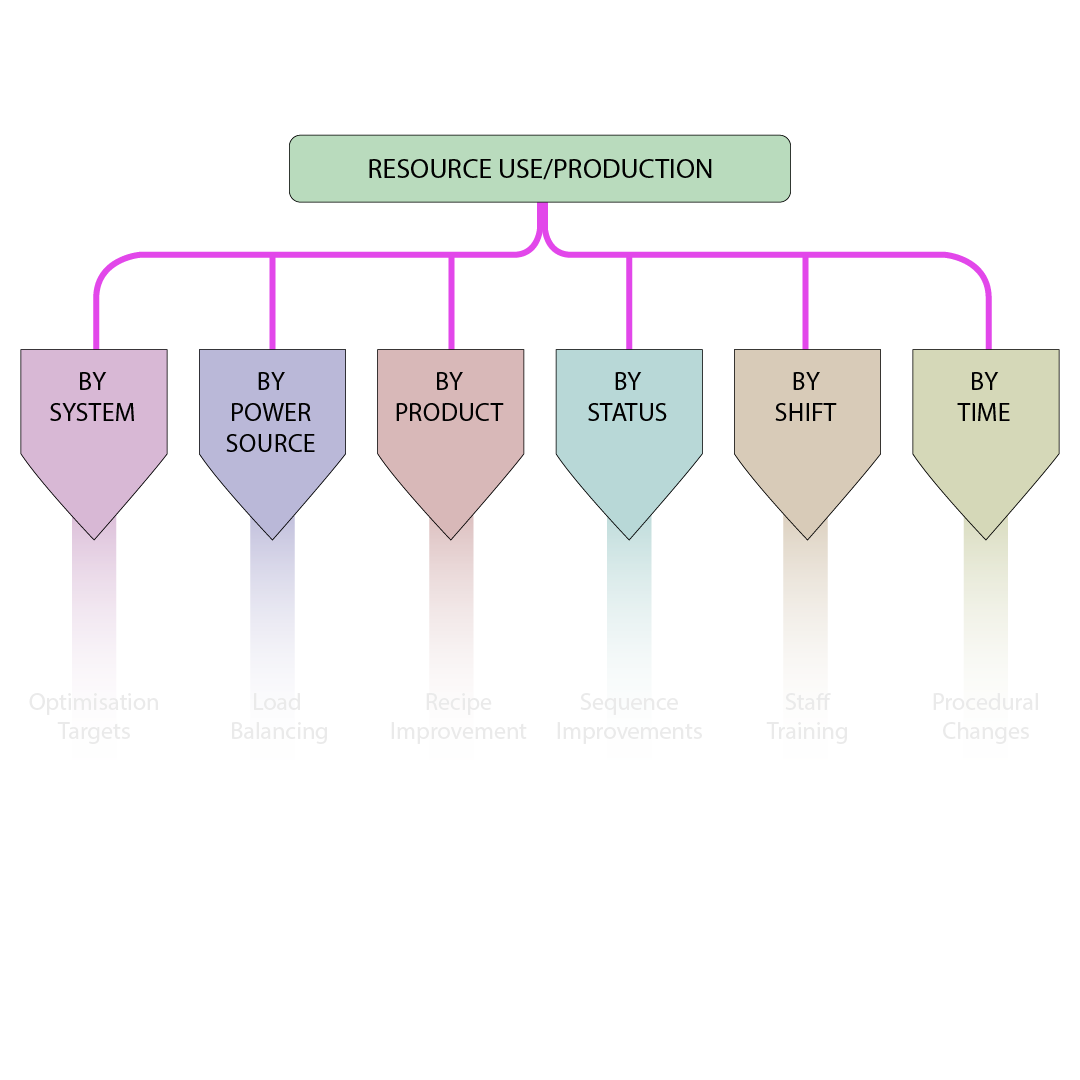
Pivoting data allows you to look at problems from a new angle by splitting it. With the Distribution addon, you can split your data based on…
This means with a couple of clicks you can answer questions like…
Effectively, you can take pieces of information that normally live in completely different systems and quickly and easily see how one effects the other.
The distribution addon primarily works when you’re pivoting on something discrete (fixed events, on/off conditions etc.). For analogue values, we offer a Scatter Plot addon that provides animated, interactive comparisons of analogue data.