What Is Utilisation?
Utilisation is an ARDI tool that lets you interactively explore how your assets are being utilised.
Since each process is unique, you first need to set up the logic for how your assets are operating. Using your consolidated ARDI data, the system will need to be set up with the logic that tells us what an assets status is (ie. ‘running’, ‘stopped’, ‘blocked’ etc), and if possible why or where it’s doing it.
This lets us can create a range of interactive dashboards and give you access to powerful API functions to analyse and report on the behaviour of assets over time.
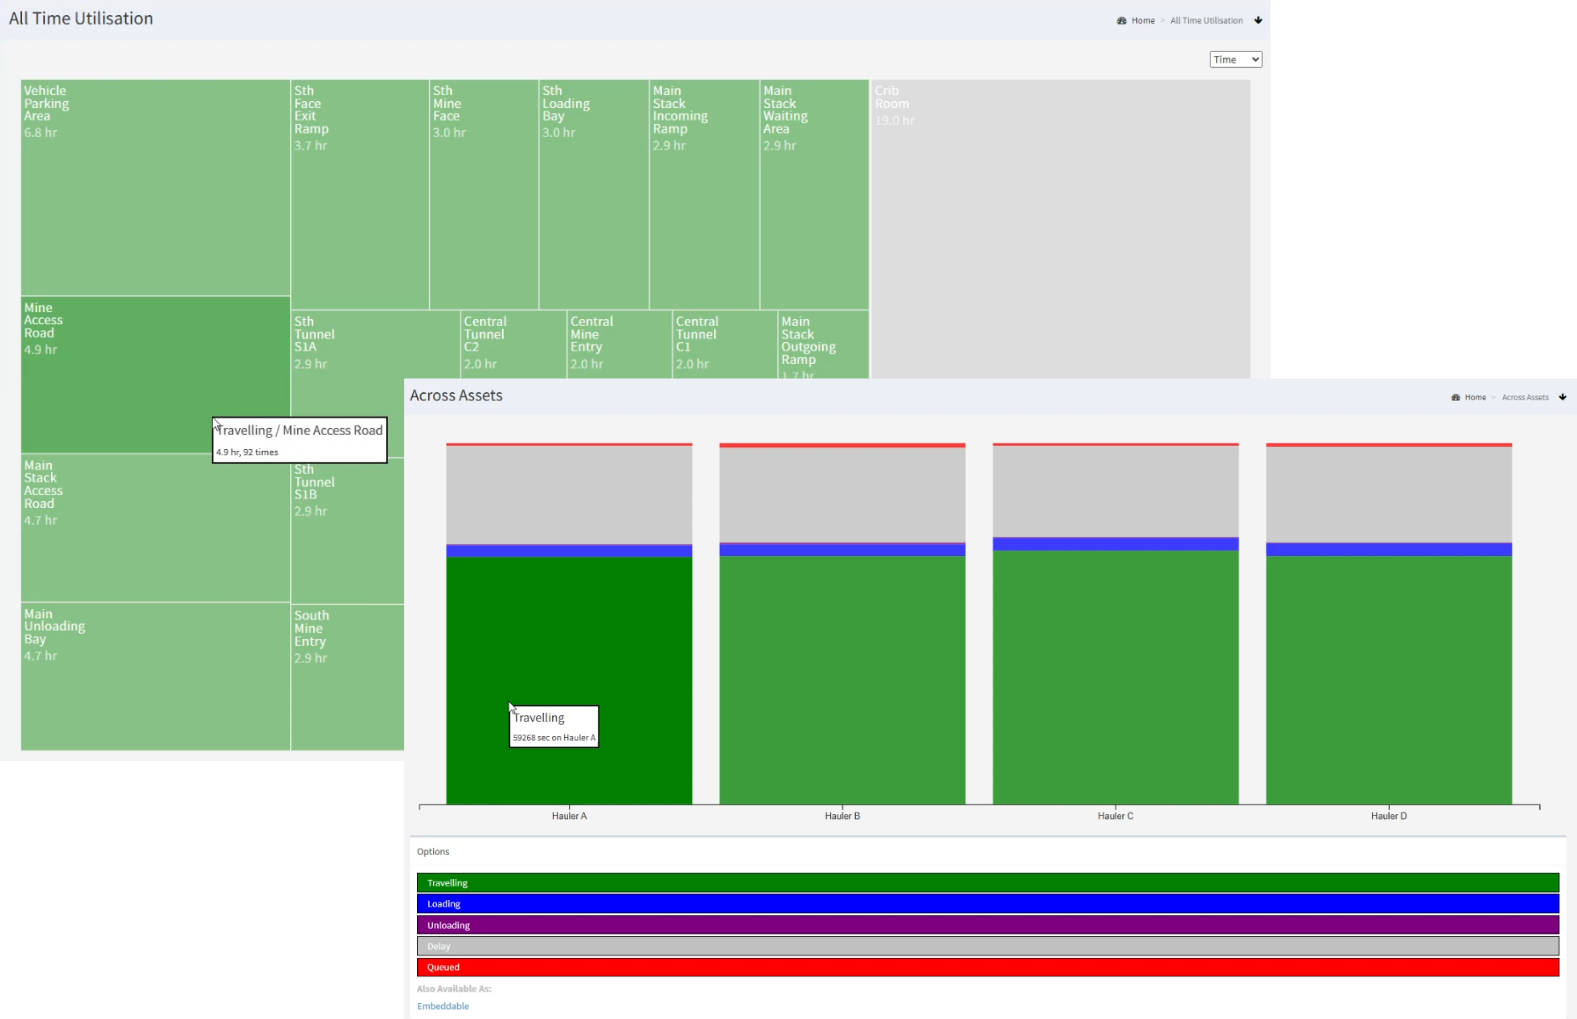
From just two pieces of data, we can produce charts that let you see…
- Where congestion and inefficiencies can be found,
- Which assets are the most utilised, and which are the least,
- Hourly or daily patterns in usage,
- Total batch/travel/job times and details of each specific task,
Once set up, it’s incredibly easy to use and highly interactive – you can explore deep into your charts to drill down further into your data.
You can have many different types of utilisation – one tracking the usage of vehicles, one of fixed machinery, one for communication equipment etc, with radically different rules and data sources. But all of them will have a single, consistent user interface to let you explore.