Data Distribution
Understanding usage, efficiency and waste across your process.
It’s often difficult to find where to begin in performance improvement projects.
If you want to understand why and when you’re consuming resources or producing at your best, you need the ability to see your data from a range of different perspectives.
ARDIs Distribution does exactly this. It allows people to easily pivot figures such as production rates, energy consumption or resource usage based on data from all of your information management systems.
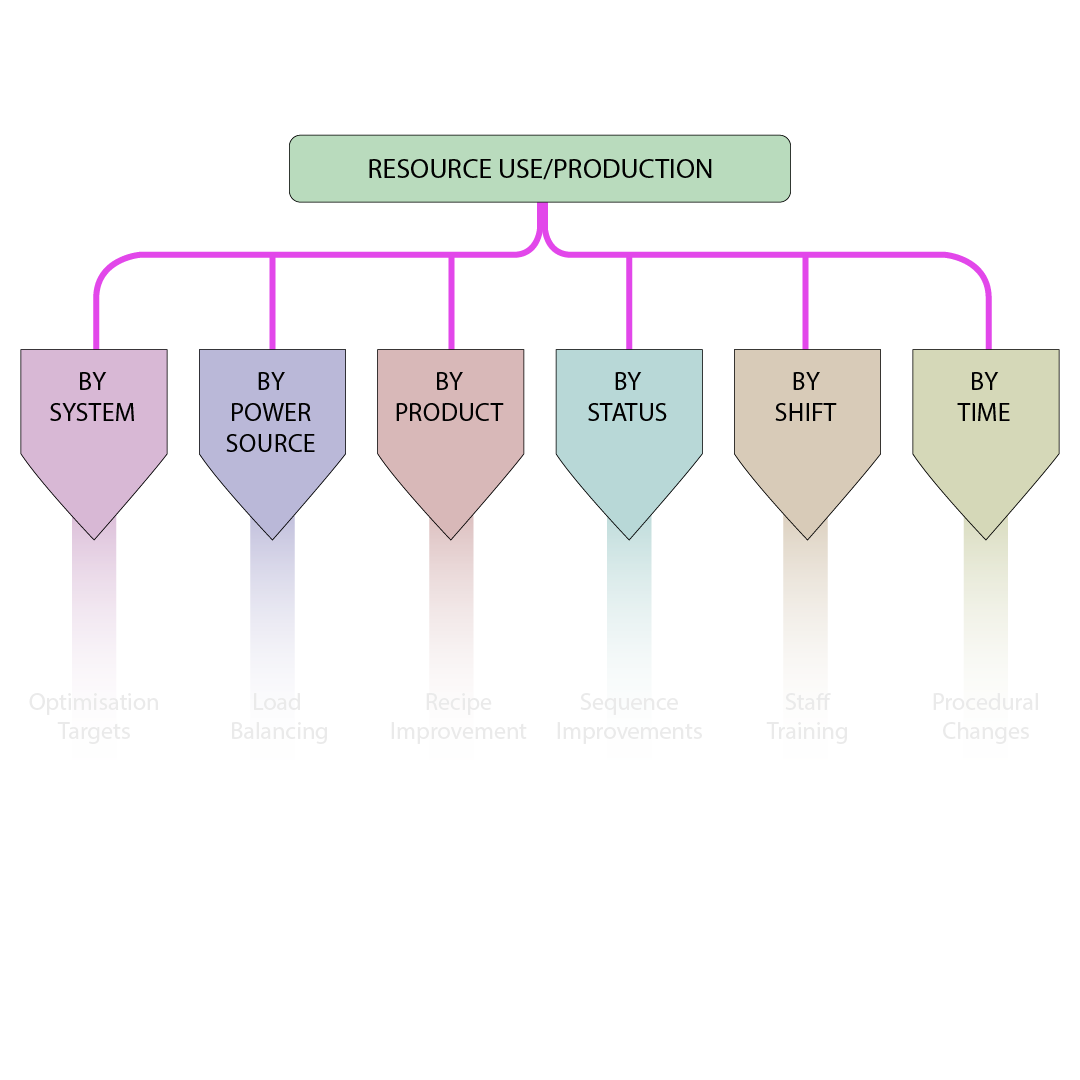
You can compare almost anything against anything else as long as they are related, such as…
| Compare | Against |
|---|---|
|
|
All with a simple point-and-click interface, human-readable names and with a system that can connect your data points based on a rich understanding of how your assets are connected.
Download a quick introduction to how you can turn simple data into valuable business insights with just a few clicks through our Distribution addon..

Press ‘Play’ on the video below to be introduced to the Disitribution addon and see how it’s used to identify inefficient or wasteful operation.