Analytic Tools
Get what you need out of your data
Having all of your data in one place opens up new opportunities for analytics.
You can combine the figures from your sensors with the details from your scheduling system to create per-batch summaries, calculate totals per shift, or flag specific patterns of activity.
Along with our REST-based APIs and query language (that you can use to easily access from a wide variety of languages and platforms), we offer several tools to help you get complex analytics working quickly.
You can trigger analytics, events, notifications and other events based on live data.
This is most often used for performing batch, order or job analytics when a system moves on to the next task, but can also be used to create event logs, event counters, or analysis based on human resources, such as shift, crew and controller.
ARDI provides a re-usable framework for making this style of solution, subscribing to live data, checking for key conditions, and even back-filling data when time is lost (for example, when a server is restarted), so it doesn’t miss any events.
ARDI offers the ability to create live models of your process.
These use your data to drive calculations. These can range from the incredibly simple to the extremely elaborate, such as…
These models are live. They run along-side your real data and provide up-to-the-moment feedback on how your process is running. They can also take advantage of functions that can’t be done in control systems – such as using machine learning, Goal Seeking and advanced analytics.
The feedback of these models is available via a number of mechanisms, including OPC-UA – allowing your analytics to be recorded in industrial historians or fed back into your HMI/SCADA system.
Dynamic alerts allow you to deploy advanced alerts across your system. These alerts can be incredibly simple, or can use cloud services, machine-learning or custom logic to detect issues and warn users of potential problems.
Alerts are dynamic because you don’t have to make new alerts for each asset in your system. Instead, you can create one alert and ‘attach’ it to many assets, based on their type, connections or combinations of data.
This means that new alerts are automatically created when new assets are built in ARDI, and old ones shut down if equipment is removed from service – all without user intervention.
Once you’ve built these analytics, what do you do with them?
The ARDI Modular Output System is integrated in several tools, and allows you to send the values you generate and the events you detect to a variety of different locations.
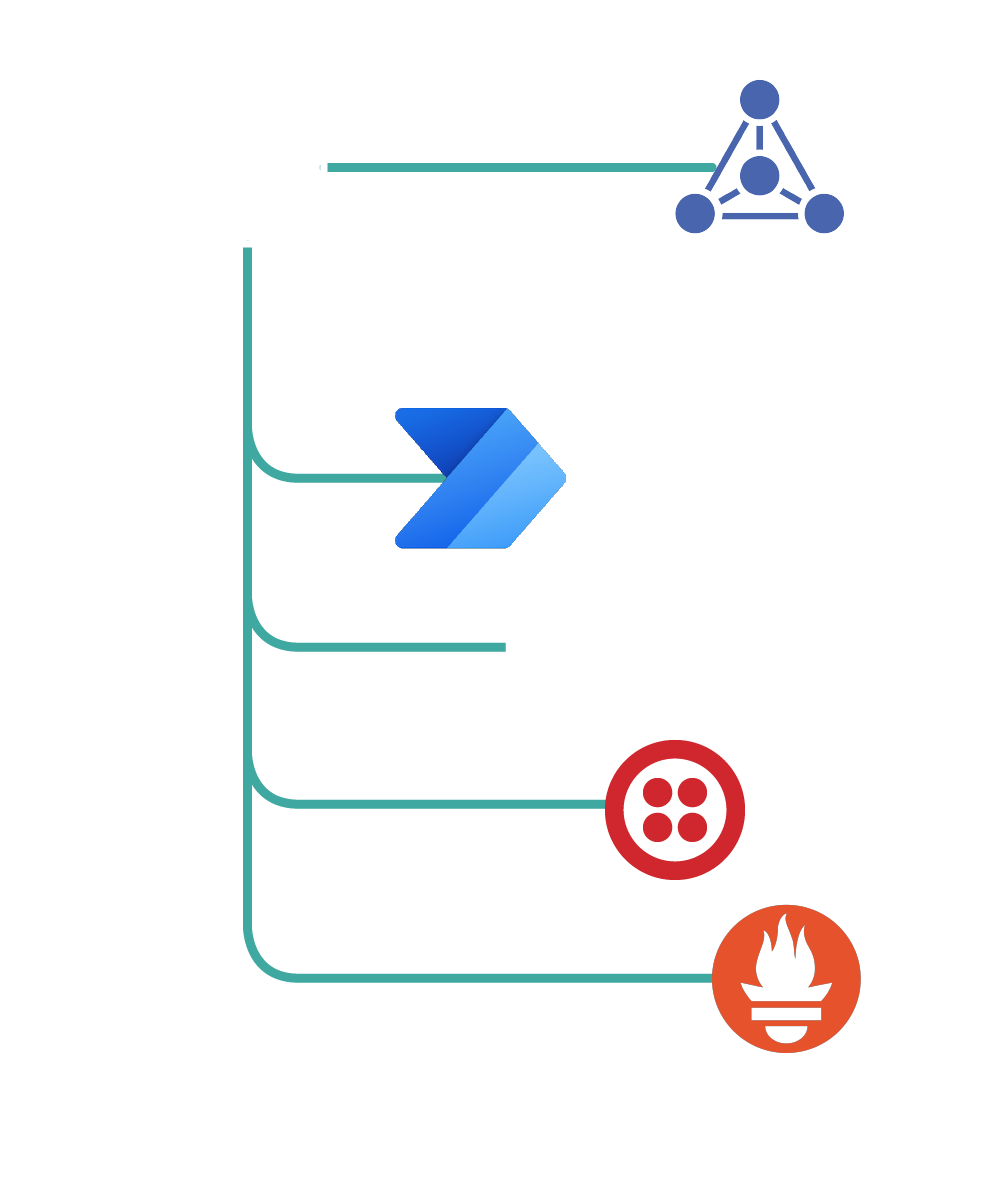
You can easily record values in databases, key-value stores, message brokers, web-endpoints or time-series databases like Prometheus. You can write values back to your control system, or pass them right back to ARDI so it’s available through ARDIs visualisations, dashboards and reports.
Events can be sent to logs, databases, notification systems such as email, SMS, voice calls, PA announcements, or can be used to trigger PowerAutomate tasks, such as creating Teams notifications.
The best way to understand the power of ARDI is to see it with your own eyes.
Simply add your contact details below and we will arrange a personal demo where we will take you on a full tour of ARDI’s backend and show live demonstrations of each capability