Overall
Every new property you add to ARDI is another potential perspective on your data.
For example, adding production information to an ARDI system – such as batch number, customer order number or product type – lets you create new reports and analytics that summarise them.
After loading your data, you can use your own logic or our library functions to create per-subject analytics and KPIs.
Example
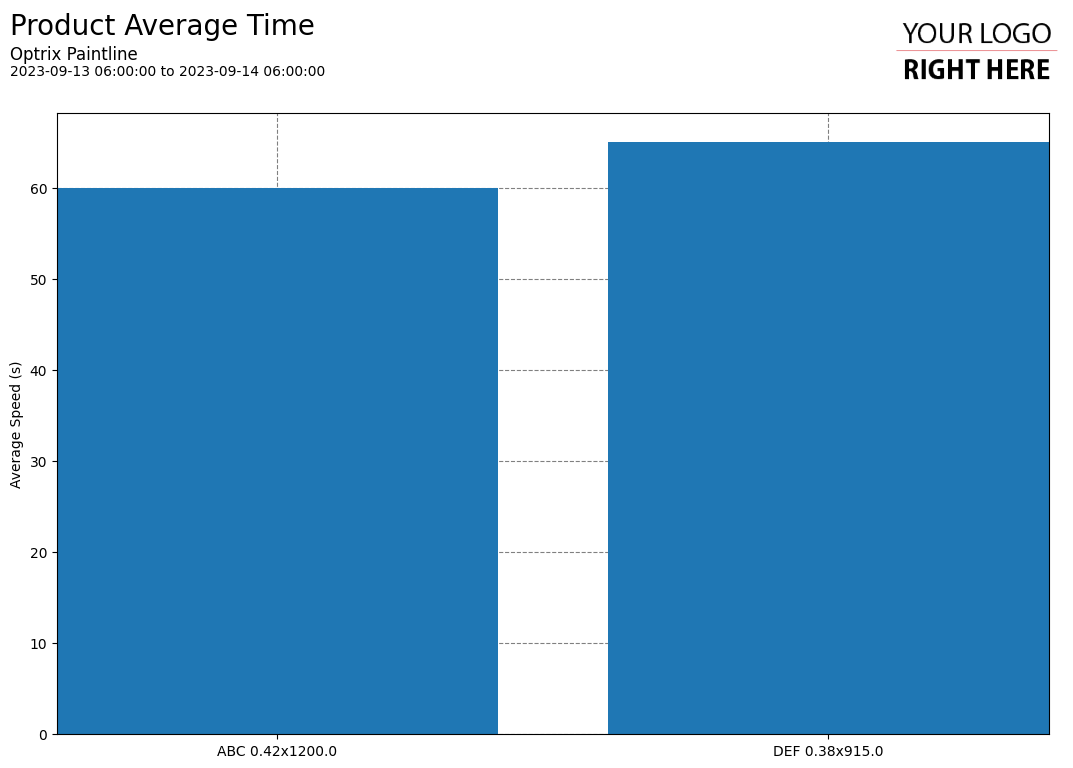
In this example, we’re showing the average speed that we are reaching when producing our two different types of product.
You can show these as a simple summary (like in the example), or you can produce more detailed reports showing how your average speed as increased or decreased over time.
If you’re creating much more detailed batch quality or traceability reports on a production line, you might need to look into Synchronised Batch Reports instead.
You can find this example on our paint line demo site.
Tips and Tricks
- You can capture any analytic values you create (such as daily/per-batch speeds) using the Modular Output System. This lets you write KPIs to databases, control systems, or even send out notifications.
- If you want reporting or analytics done immediately once batches or orders are complete, you can use ARDIs trigger system to immediately start reporting or analytics the moment the batch or customer ID changes.
See Others
Analytic visualisationsBar visualisations
Report visualisations
Summary visualisations
Vertical visualisations