Overall
With ARDI, every new data source becomes a new perspective you can use when viewing your data.
For example, you can use our Shifty data source, custom logic or connect to a time-clock system to read your shift, crew or duty schedules into ARDI, which can then let you report on their relative performance.
After loading your data, you can use your own logic or our library functions to create per-subject analytics and KPIs.
Example
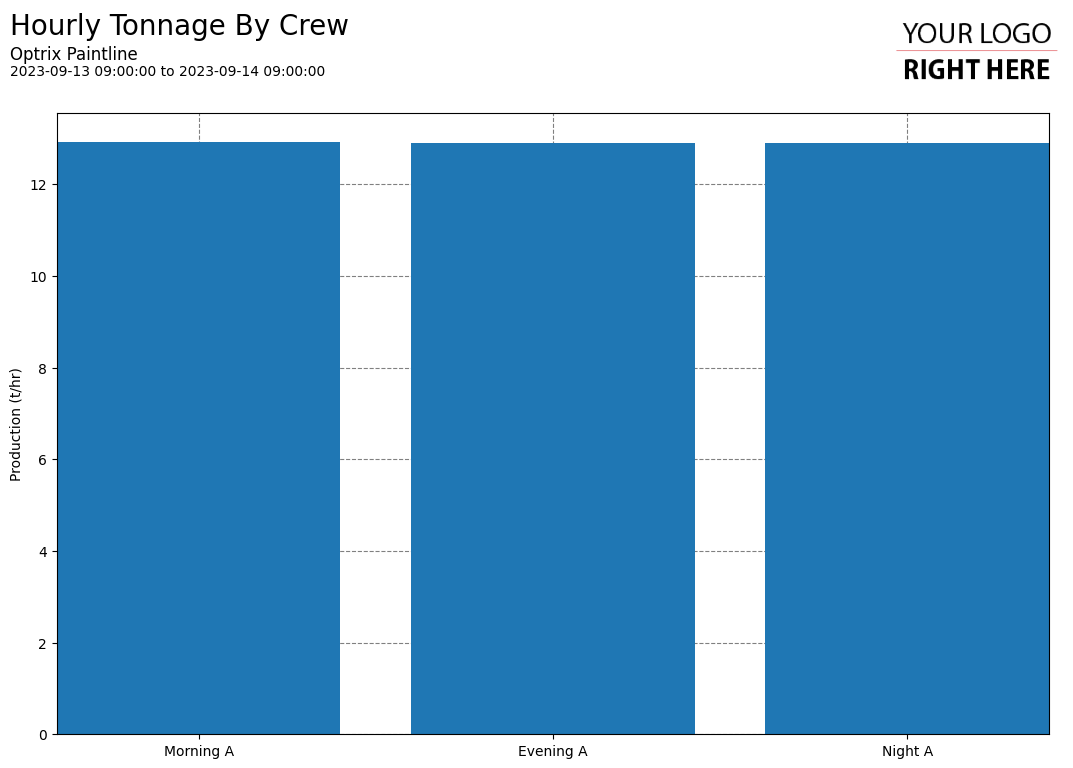
In this example, we’re showing the total amount of production achieved per crew.
When comparing crews, it’s very important that you come up with a fair metric – one that doesn’t punish your staff for things that are outside their control.
In a paint-line, some shifts may produce long lengths of thin product – this can be produced very quickly. Other crews will work with thicker product, which must be processed slower. So to be fair, we’re comparing the crews based on tonnage per operating hour rather than the length of product they produce.
We also need to ensure that the product their making isn’t unpainted, wasted or poor quality product.
And we also want to avoid making a crew look bad when there’s an outage or other maintenance event that prevents them from operating.
So internally, the report goes through the following steps…
- Getting the shift time-windows from ARDI as events
- Getting all of the scheduled maintenance time-windows from ARDI as events.
- For each shift, we get the line speed, thickness, width and production status at high resolution. We then calculate the total produced tonnage for the shift.
- We then divide that tonnage by the total length of the shift (in hours), minus any hours lost to maintenance.
You can find this example on our paint line demo site.
Tips and Tricks
- You can capture any analytic values you create (such as shift totals) using the Modular Output System. This lets you write KPIs to databases, control systems, or even send out notifications.
See Others
Analytic visualisationsBar visualisations
Report visualisations
Summary visualisations
Vertical visualisations