Overall
In some cases, you might not know the exact asset you’re planning on reporting on, particularly if you’re deploying a single visualisation between different locations.
Using ARDIs query language, it’s possible to create reports completely dynamically. You can know nothing about an asset other than it’s name or location, and automatically create an informative report around it.
Example
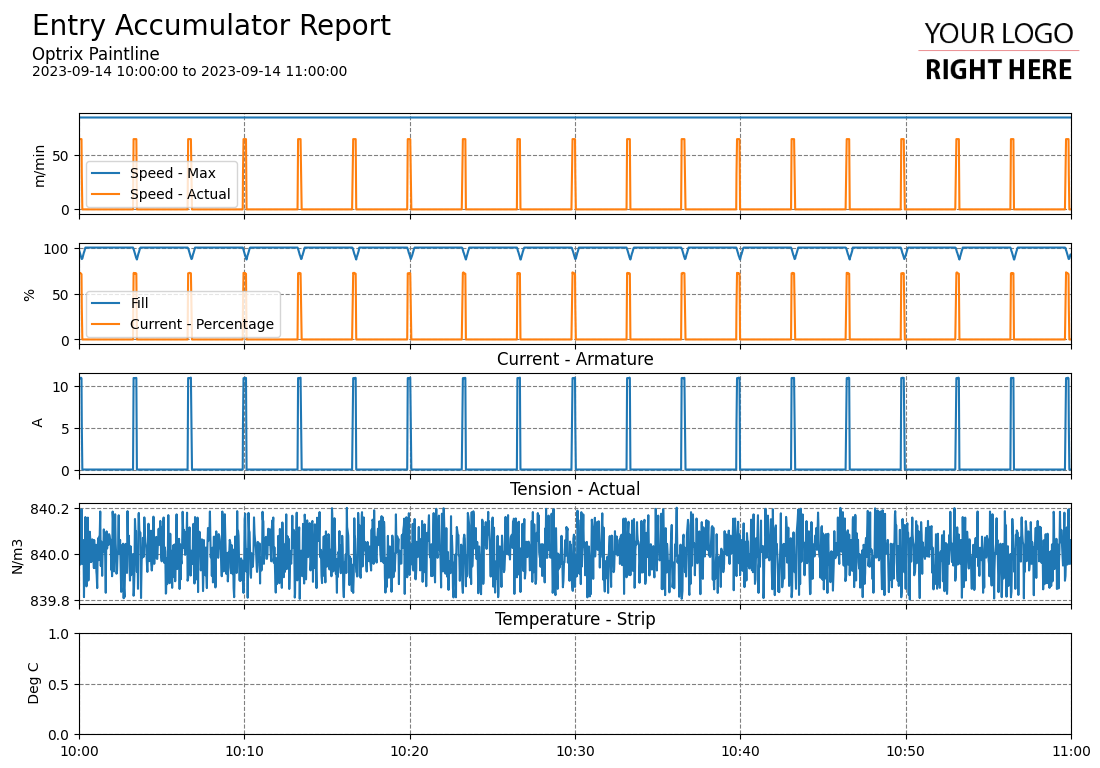
In this example, we’ve asked for an automatically-generated report for our Entry Accumulator, a piece of equipment that stores product so that our line can keep running for a while when there’s no new products being fed in to the system.
The report has two pages – the first is devoted to the analogue values, such as speed and tension. The second page is about discrete values, such as if the machine was running or not.
You can find this example on our paint line demo site.
- This is an example of an ARDI report that adjusts to one specific asset – it’s also possible to create dynamic reports that adapt to assets being added to or removed from your system.
See Others
Bar visualisationsDynamic visualisations
Horizontal visualisations
Line visualisations
Report visualisations