Overall
Control reports are useful for checking if, when and how often your process as been out of control. But if you’re trying to prevent control losses in the first place, it’s often a good idea to monitor the lag between the target changing and your process achieving it.
If your lag is increasing, this indicates that your control is in greater danger of failing.
Example
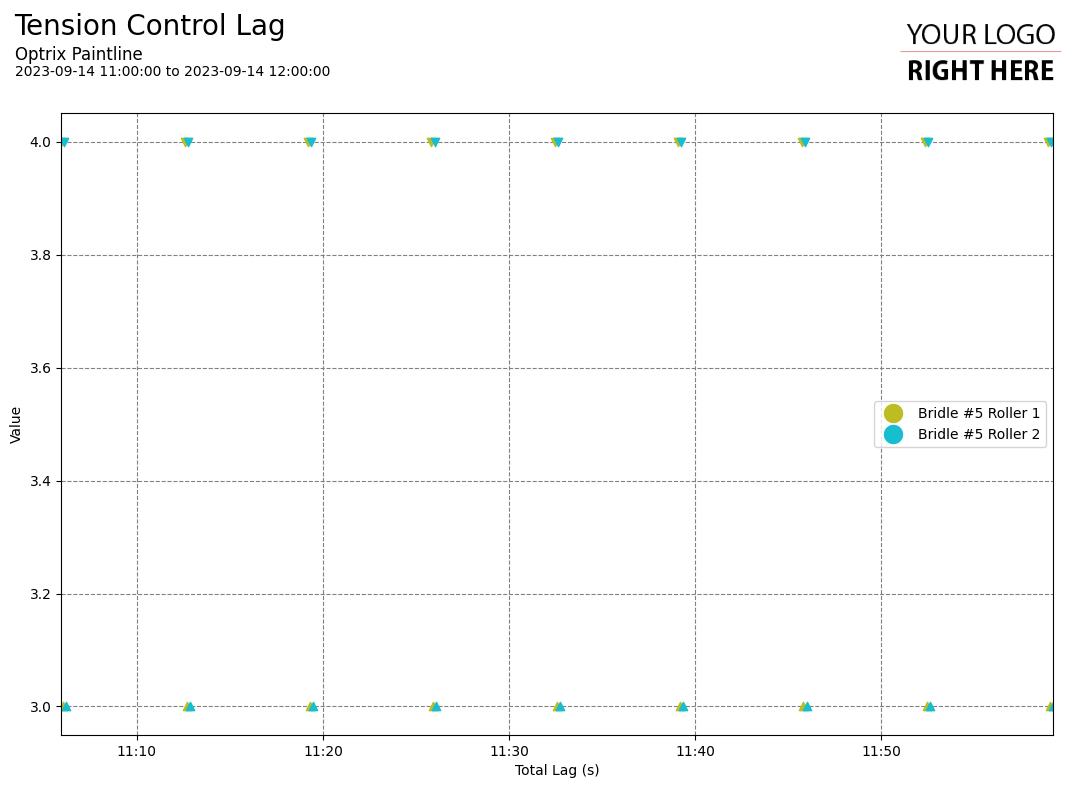
This example requests the average control lag time for tension – the total time it takes between when the control system asks for a change in tension, and when the hardware delivers that change and the value is stable.
The tension in this system changes consistently. From the report, you can see that it takes approximately 3s for the tension to be brought to the target value when the tension increases (the up arrows), and it takes 4s for the tension to be brought to target when the tension decreases.
You can find this example on our paint line demo site.
- This value can also be summarised as a simple bar-chart rather than shown per-event, although the per-event reporting makes it easier to identify outliers, and spot when significant issues occurred.
See Others
Analytic visualisationsControl visualisations
Horizontal visualisations
Report visualisations
Scatter visualisations
Summary visualisations
Timing visualisations