Overall
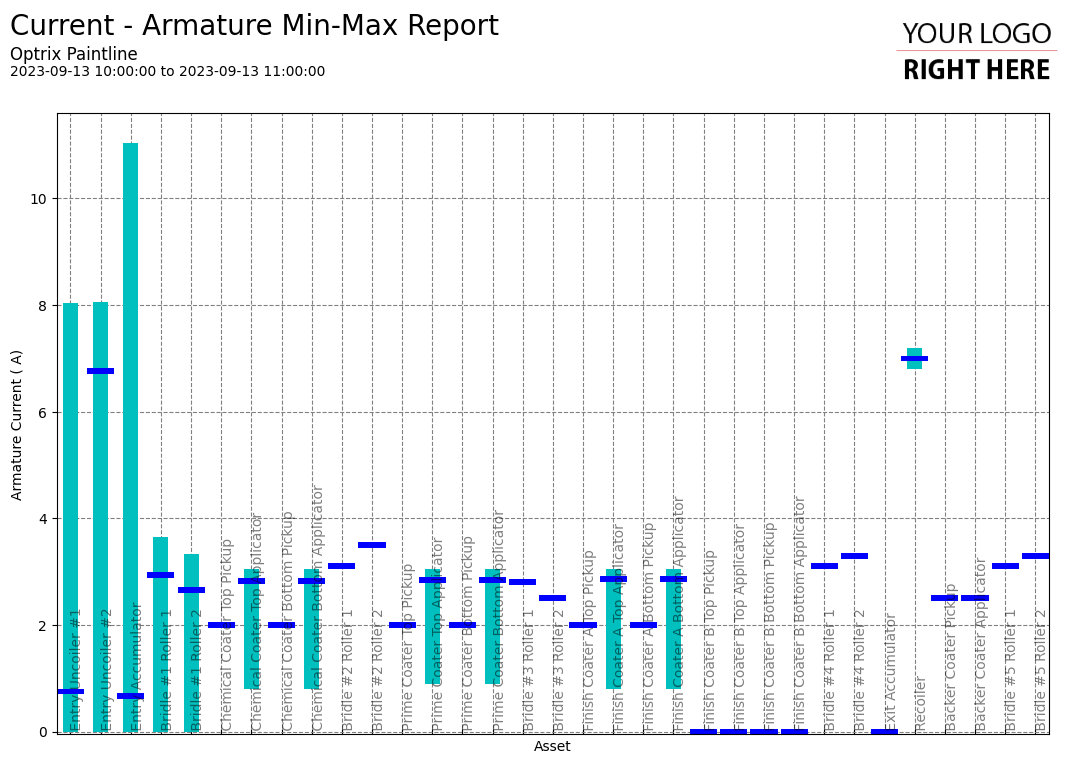
These reports are used to find the minimum, maximum and average values of a particular property across a set of different assets.
This can be an easy way to spot unusual activity on your site – sudden changes on an individual asset from day-to-day can indicate issues that need further investigation.
Example
You can find this example on our paint line demo site.
Tips and Tricks
- By themselves, these reports are often only useful when compared to the previous days report, to see changes over time. However, ARDI’s reporting AI engine can automatically compare the current values to the ‘normal’ behaviour, and highlight when something seems unusual.
- If limits are known, you can significantly improve this report by including the expected minimum and maximum limits of each property, where available. You can see an example of this report with limits to see how it makes the report more effective.
See Others
Bar visualisationsReport visualisations
Summary visualisations
Vertical visualisations