Overall
Reducing your outages (sometimes also referred to as down-time, stoppages or non-production time) are a key to getting the most out of your process. But you can’t reduce something until you’ve managed to identify the reasons behind the losses in production.
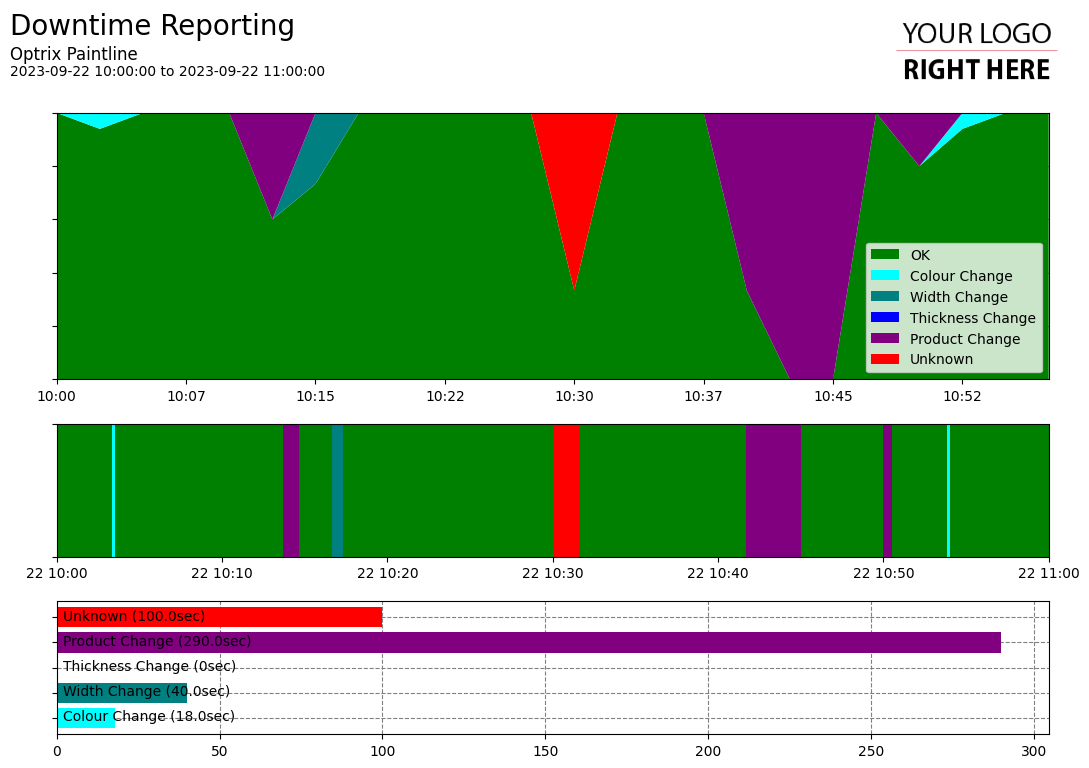
ARDI can be used as a tool to not only identify when your outages happened, but also classify why they happened.
Example
This example report looks at all of the down-time across the reporting range.
To create a report like this, you’ll first need figure out the logic to determine if there is an outage. On most sites, this can be a simple digital signal – but in other cases it can require complex rules.
Then, you’ll need to determine the rules for checking what type of outage you’re having. In this case, some common outage types are caused by changes in the product that the system is producing, so we can quite easily check the state of the system before the outage to the state of the system after the outage to determine if it was a change in colour, product, thickness or width. Note that even that simple logic still has some complexity – an outage to change colour shouldn’t take more than a minute or two. If the event takes longer than that, it’s automatically flagged as ‘unknown’.
If the outages are too complex or differences too subtle for you to be able to make the rules that categorise your outages, you can use AI – it may be able to pick up the I/O signature that differentiates your stops from one-another.
You can also use events to help categorise your outages. You might have a list of maintenance times coming from Office 365, or planned stoppages from your production scheduling system – you can use these events to make sure the scheduled outages are correctly displayed.
The demo report can be found in our paint line demo site.
Notes About Accuracy
It should be noted that it’s almost impossible to correctly classify all of your outages using only signals from the field, which is why our example report includes an unknown outage. While an automated system can certainly pick up a large number of potential outage causes (ie. change of product from the EMS, spray activations for cleaning, events from the maintenance system etc.), there will often be outages caused by operational, human or mechanical factors that aren’t picked up by your sensor network.
Connecting your ARDI server to a source of manually-entered event information (such as a database or Excel spreadsheet) can help add the final piece of the puzzle to correctly classify those outages that can’t be recognised by I/O alone.
See Others
Analytic visualisationsArea visualisations
Production visualisations
Report visualisations
Summary visualisations