Overall
You can use ARDIs knowledge of the relationships and structures between your assets to create diagrams of your connections.
This specific style of diagram focuses on presenting a single relationships for a all of the assets that use it, giving you a single top-down look at the connections across your entire ARDI database.
Example
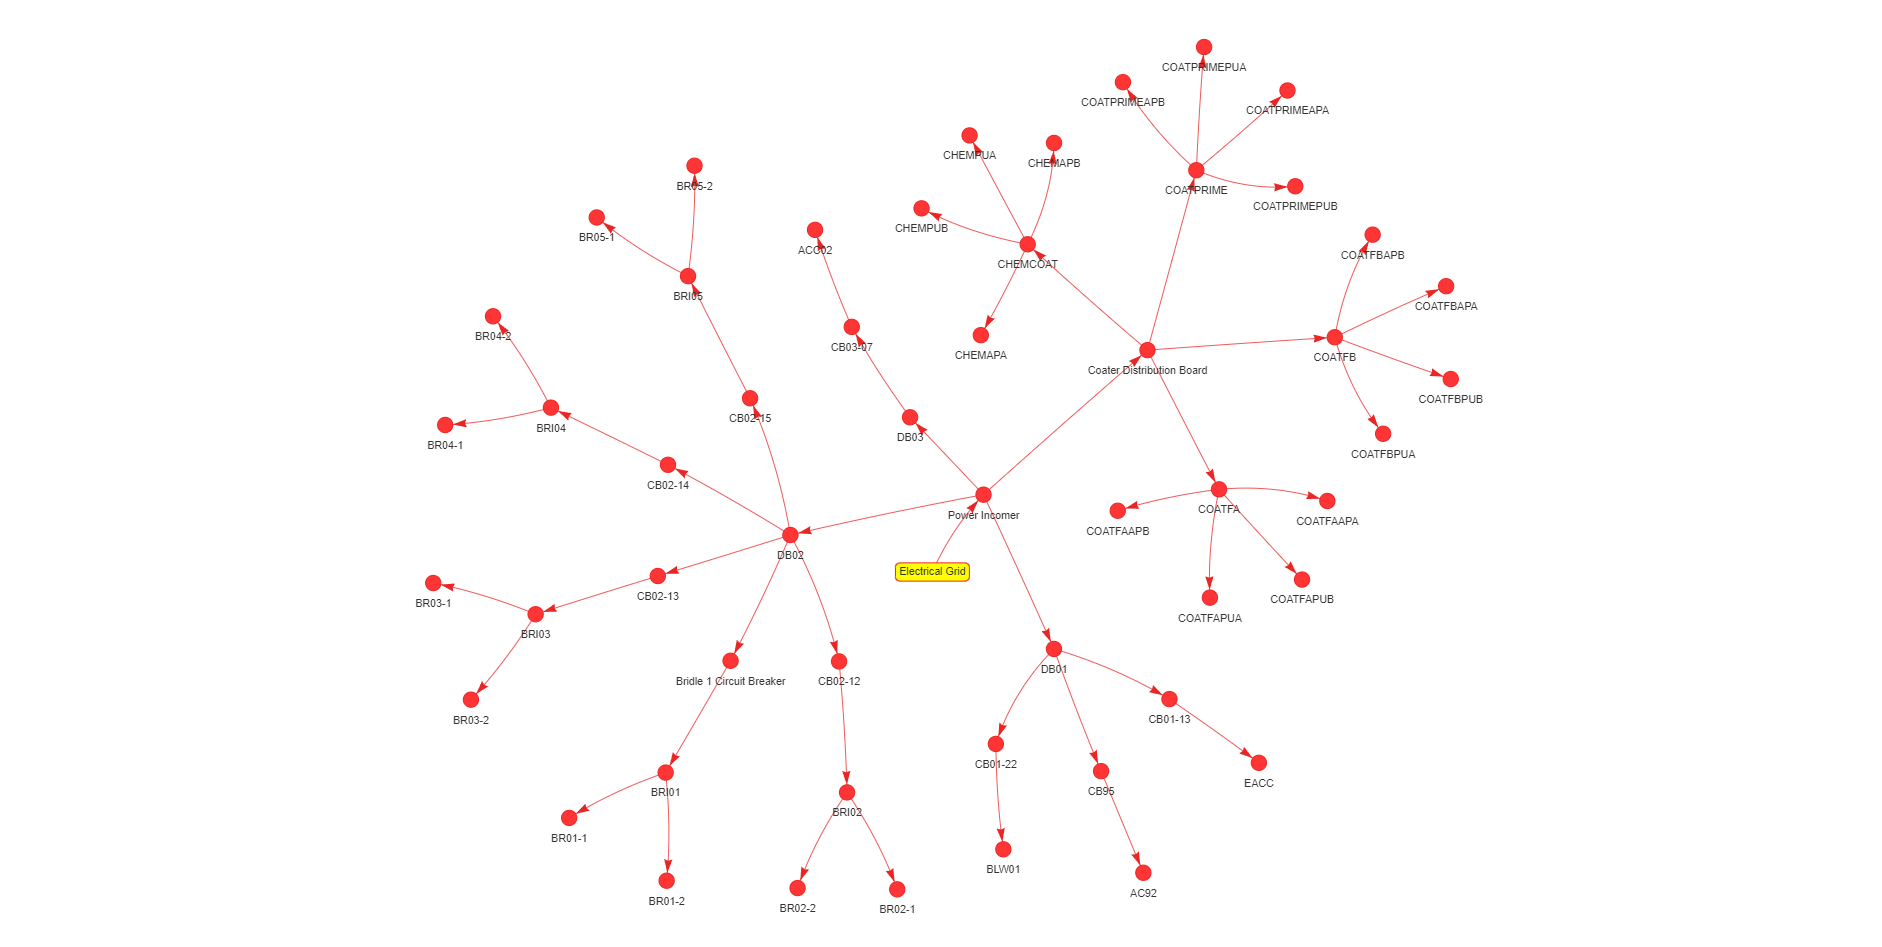
This example shows the AC Power relationship on our paint-line, from the grid into our incomer circuit, then out to all of our equipment.
Different types of relationship will often exhibit different structures when viewed in these sorts of display (known as a force-directed network diagram). Electrical relationships will often look like flowers or fireworks displays, with branches that ‘explode’ to a number of different systems.
Air systems are often more tree or shrub-like, with clusters of branches leading off from isolation values.
You can find this example on our paint line demo site.
See Others
Directional visualisationsDynamic visualisations
Interactive visualisations
Network visualisations
Report visualisations