Overall
You can use ARDIs knowledge of the relationships and structures between your assets to create diagrams of your connections.
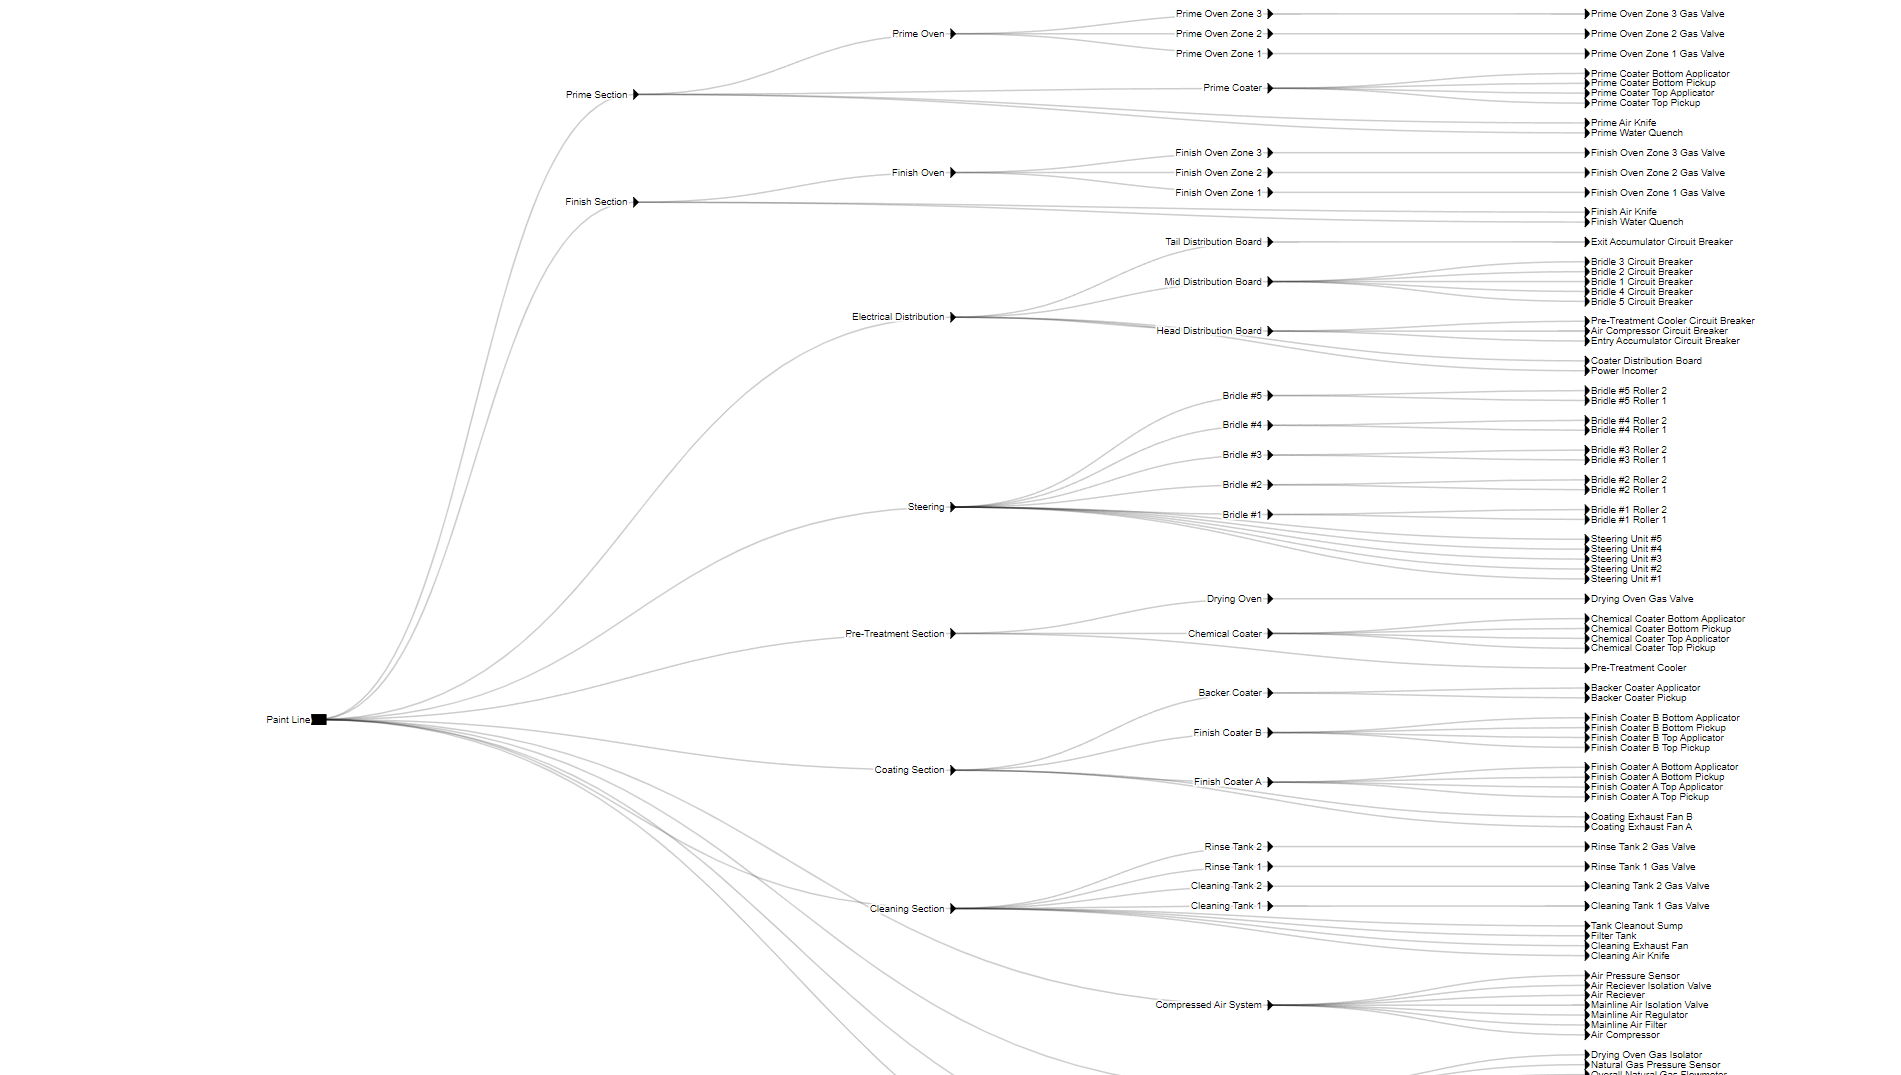
This specific style of diagram focuses on presenting all relationships for a single asset, giving you an idea of what is part of, controlled by, dependent on or otherwise considered ‘down’ from the selected asset.
Example
This example shows the down-stream assets from our Paint Line, which is the central hub of our site. You can see there are quite a lot of different assets that make up the paint-line and it’s many individual systems.
You can find this example on our paint line demo site.
See Others
Directional visualisationsDynamic visualisations
Network visualisations
Relationship visualisations
Report visualisations