Overall
Timeline reports are generated by the Timeline ARDI addon.
A timeline shows you all of the statistically significant events that happened across your entire site – or a chosen sub-section of your site – across a narrow frame of time.
The display is interactive, so you can hover your mouse over the points to get details on exactly which assets performed what action, and click through to charts showing the specific events.
Timeline displays are extremely useful when you’re trying to determine what the process was doing during a given time, or having difficulty finding the root causes of a particular issue.
Example
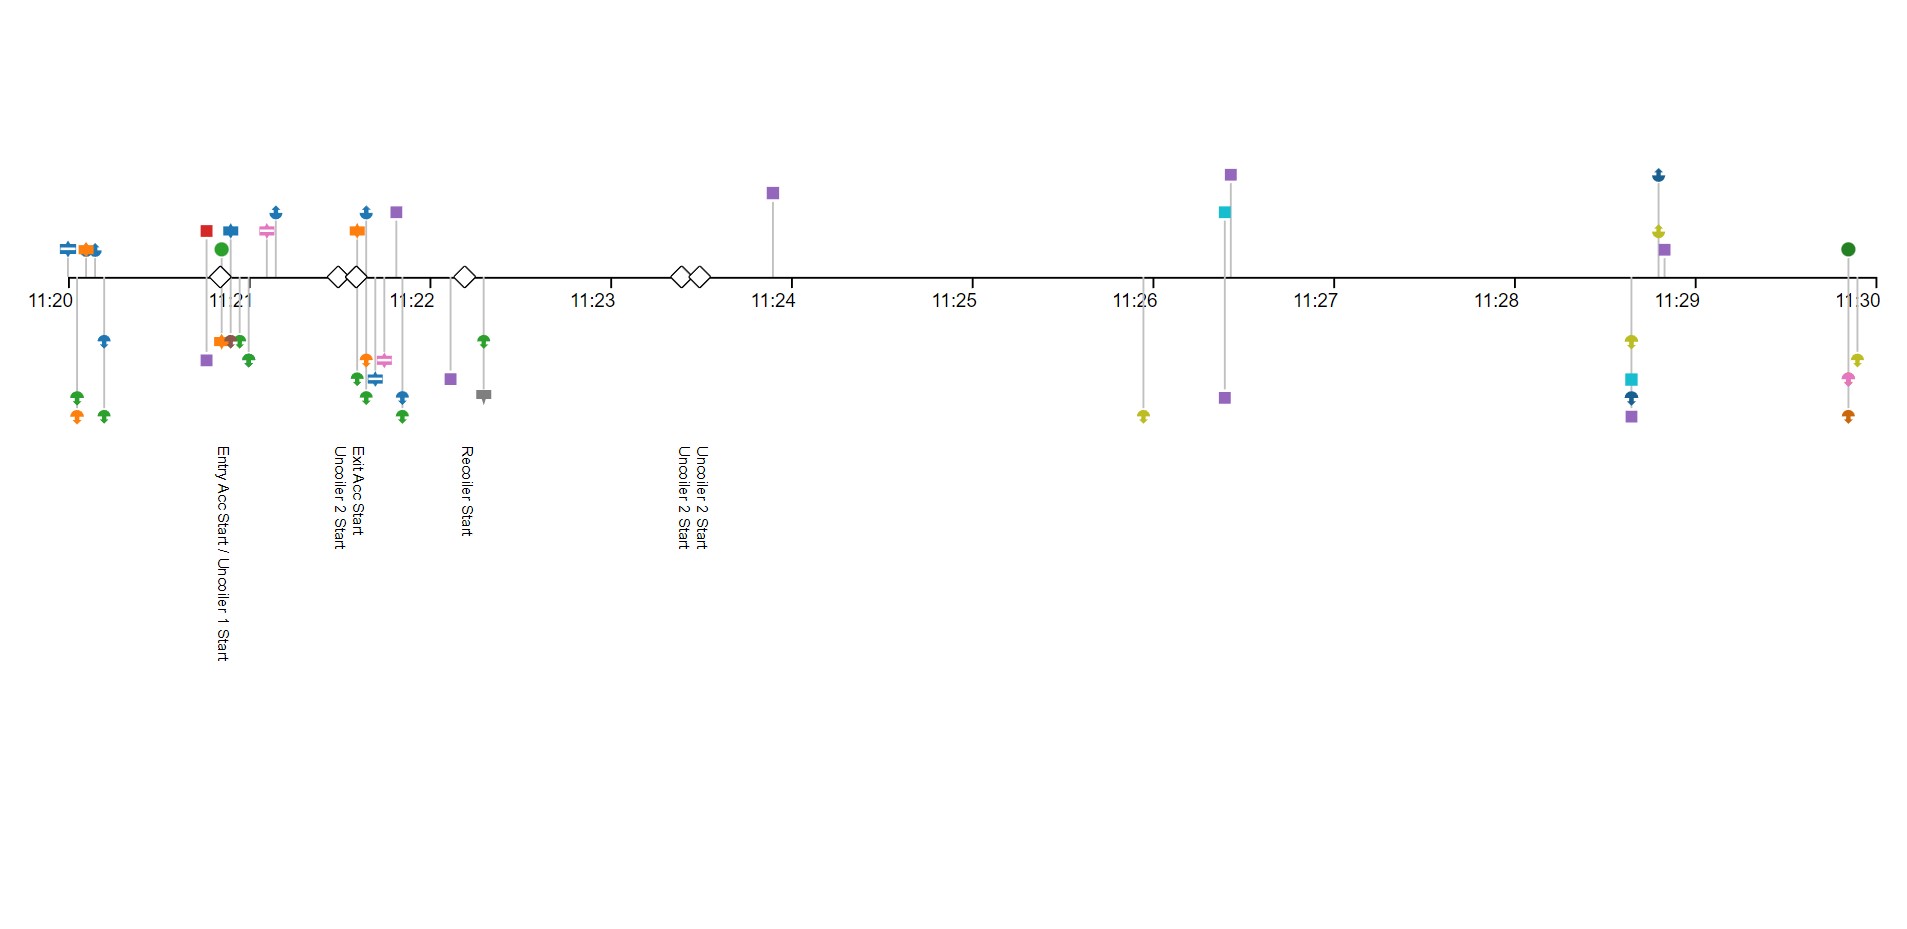
In this report, you’ll see the timeline itself across the center of the display.
A number of coloured events branch off from the timeline – these are the individual events that have been detected by the Timeline system. A single symbol may summarise several of the same property behaving in the same way – for example, an upwards-pointing brown arrow indicates a rise in temperature across five different assets. You can hover your mouse across the symbols to discover more.
You may also notice diamonds that overlap the timeline. These are patterns – combinations of changes that are the expected behaviour of your system, such as when you change settings between product types, batches or shifts.
As you create more patterns, your timeline display gets simpler – until the only remaining symbols are caused by unusual behaviour.
The demo report can be found in our paint line demo site. NOTE: Since other users may have produced reports covering different time-frames, the timeline might need to be re-generated, which will take 20-30 seconds.
See Others
Analytic visualisationsDynamic visualisations
Interactive visualisations
Report visualisations
Summary visualisations
Timing visualisations