Overall
Production lines often have a number of machines spread from the beginning of the line where unfinished product enters, and the end of the line where the finished product exits.
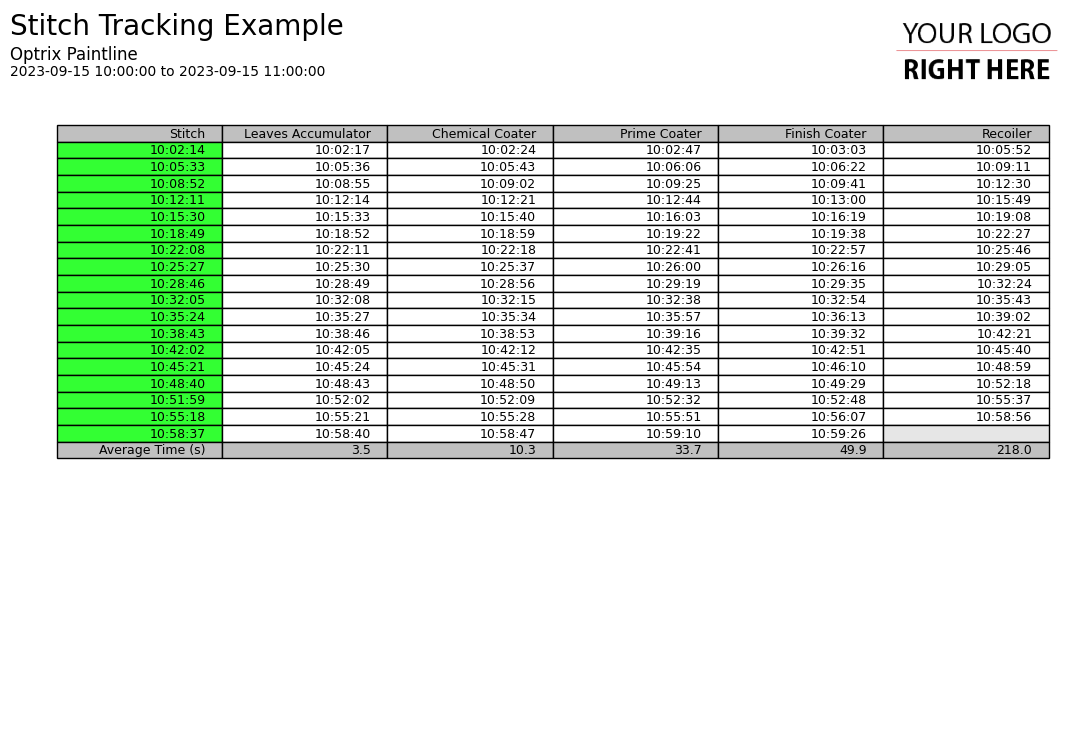
When events happen at the start of the line (such as batches starting, a change between product, or a bad quality being detected), it’s useful to be able to track the item or location of the event as it passes through your system.
We offer tools to help take your raw sensor readings from your rollers, conveyors or other speed-monitoring or item-counting systems, and analyse them to virtually track a specific point or item through your process.
Example
On a paint line (which applies paint to a strip of steel), you need to ensure a constant supply of product coming in – you can’t have a ‘gap’ between the products you make.
To achieve this, they will weld the next strip to be painted to the previous strip, making a continual stream of product that never ends.
The catch is that the equipment along this line expects the surface of the strip to be quite smooth – the sudden and often rough bump of the weld can damage the paint rollers, which means the machines need to pull themselves out of the way as the weld passes. To accomplish this, they need to track this weld as it passes through the system.
ARDI uses its relationships, details about the strip length at each key point and the various speed sensors to track these welds and determine exactly when they reached particular machines.
This data can be used to power analytics, ensuring the machines are responding properly to the approaching weld. They’re also used for line-synchronised batch reports.
This report can be found in our paint-line demo site.
See Others
Analytic visualisationsReport visualisations
Summary visualisations
Table visualisations
Timing visualisations