Overall
ARDI now offers a Visual Analytic addon, which lets users create no-code common analytics through the ARDI web interface.
This creates both a simple web-based display of the analytic, and an API function that you can call to create reports, spreadsheets or use the analytic in other ways.
Example
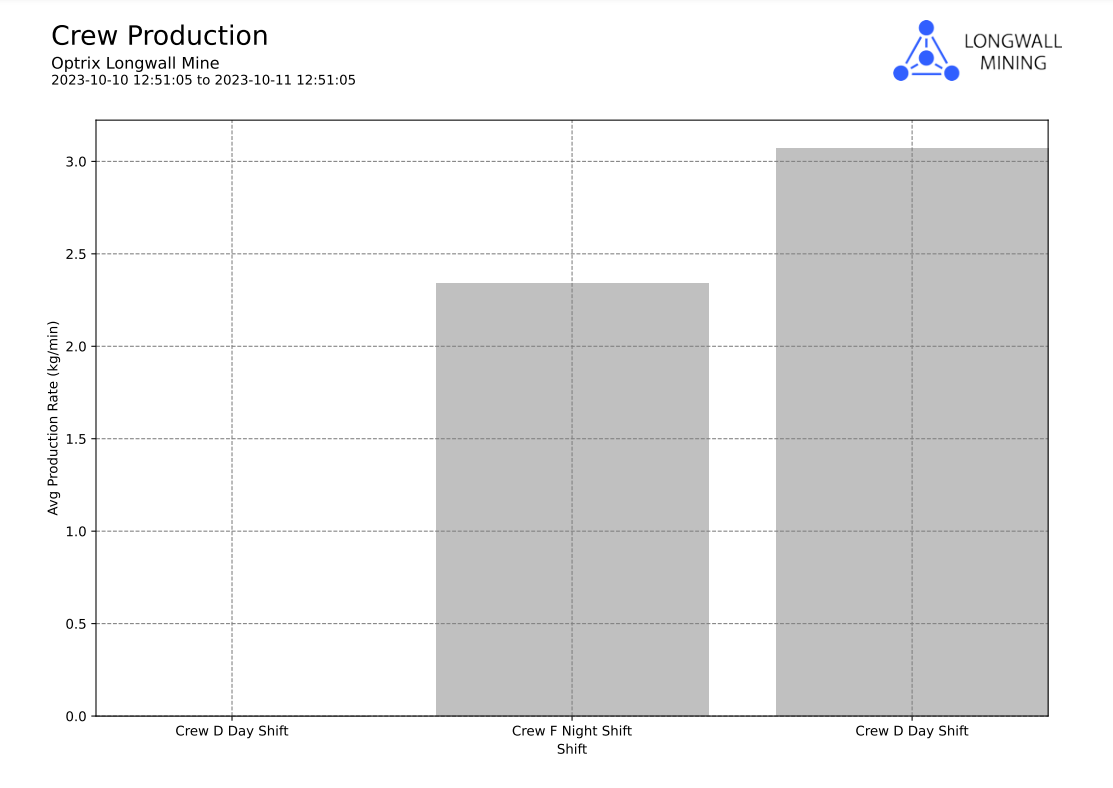
We monitor how much product is being extracted per-minute in our longwall mine example.
We also have a series of events that tell us when our different crews come on and off shift.
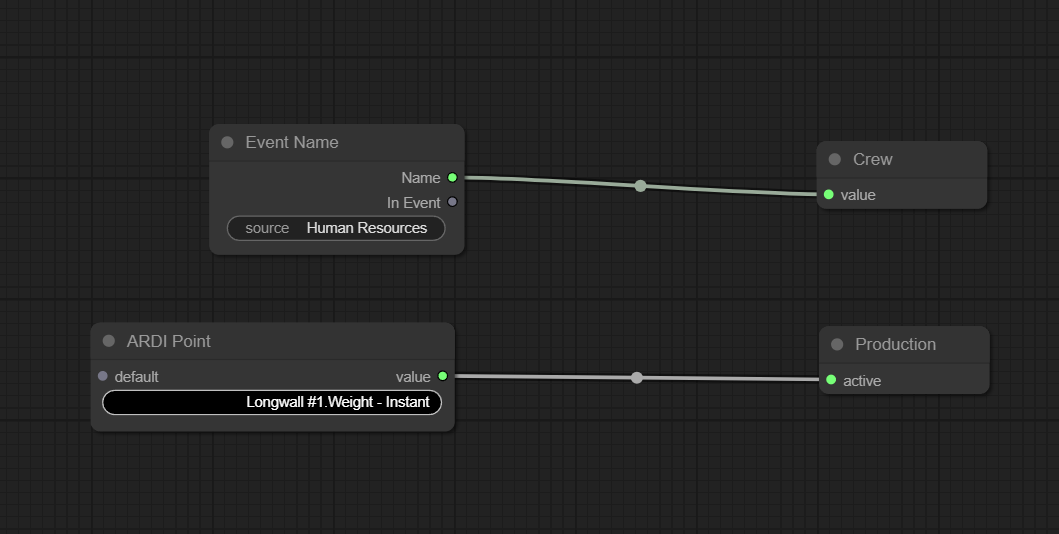
Using the visual analytic editor, we’ve created an event pivot analytic that takes channels of information and provides minimum, maximum and average values for per event. When we hook this into the source of shift and crew events, this gives us per-crew, per-shift reporting.
This style of analytic is very useful, as it allows the user(s) to define their own logic – they can analyse several different channels, they can pivot on calculations, properties, logic and events, and choose what data to completely ignore – all without writing any code.
See Others
Analytic visualisationsDynamic visualisations
Production visualisations
Report visualisations
Summary visualisations