Skip to content
Home
Discover ARDI
What Is ARDI?
Why Use ARDI?
ARDI Components
Product Suite
AR / Field Access
360 Photography
3D Environments
Traditional Reporting
Interactive Reporting
Diagnostic Tools
Analytic Tools
Using ARDI
Compare Editions
My Account
Documentation
Downloads
Pricing
Support
Discover More
About Us
Contact
Careers
Frequently Asked Questions
Articles
News
Integrations & Addons
How-To Articles
Search
Try ARDI
Interactive Visualisations
All visualisations tagged with 'interactive'
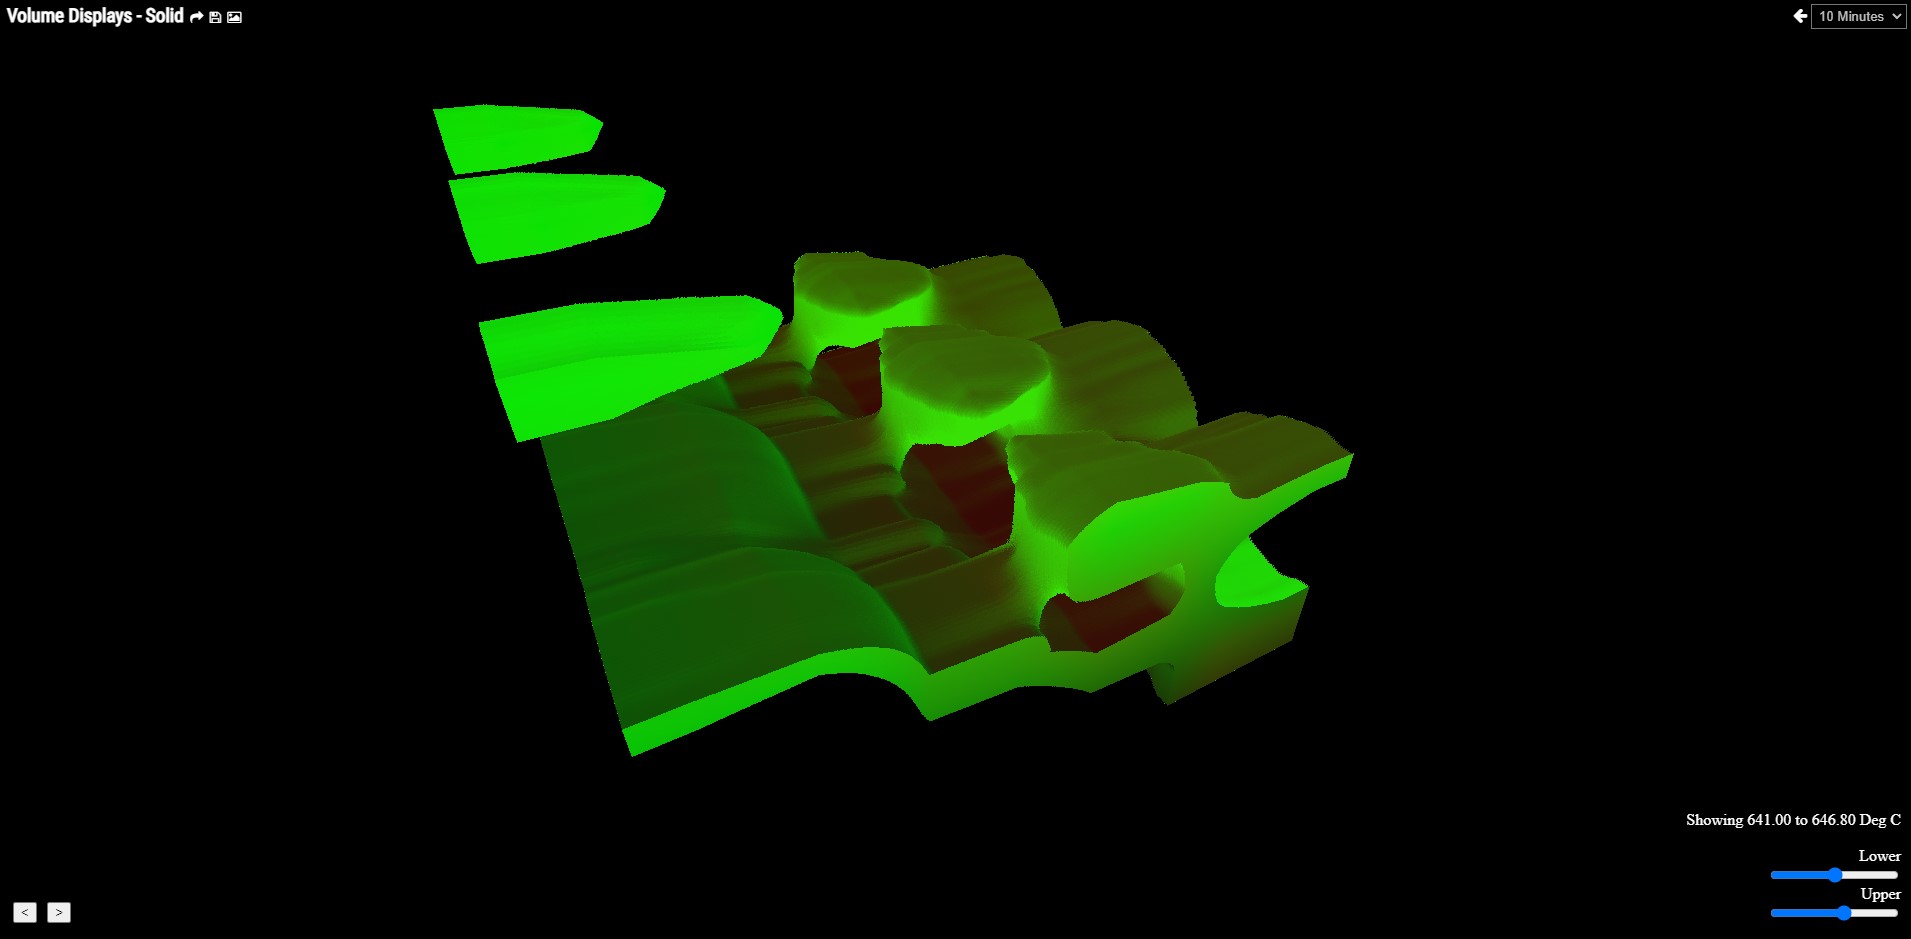
Solid Volume Display
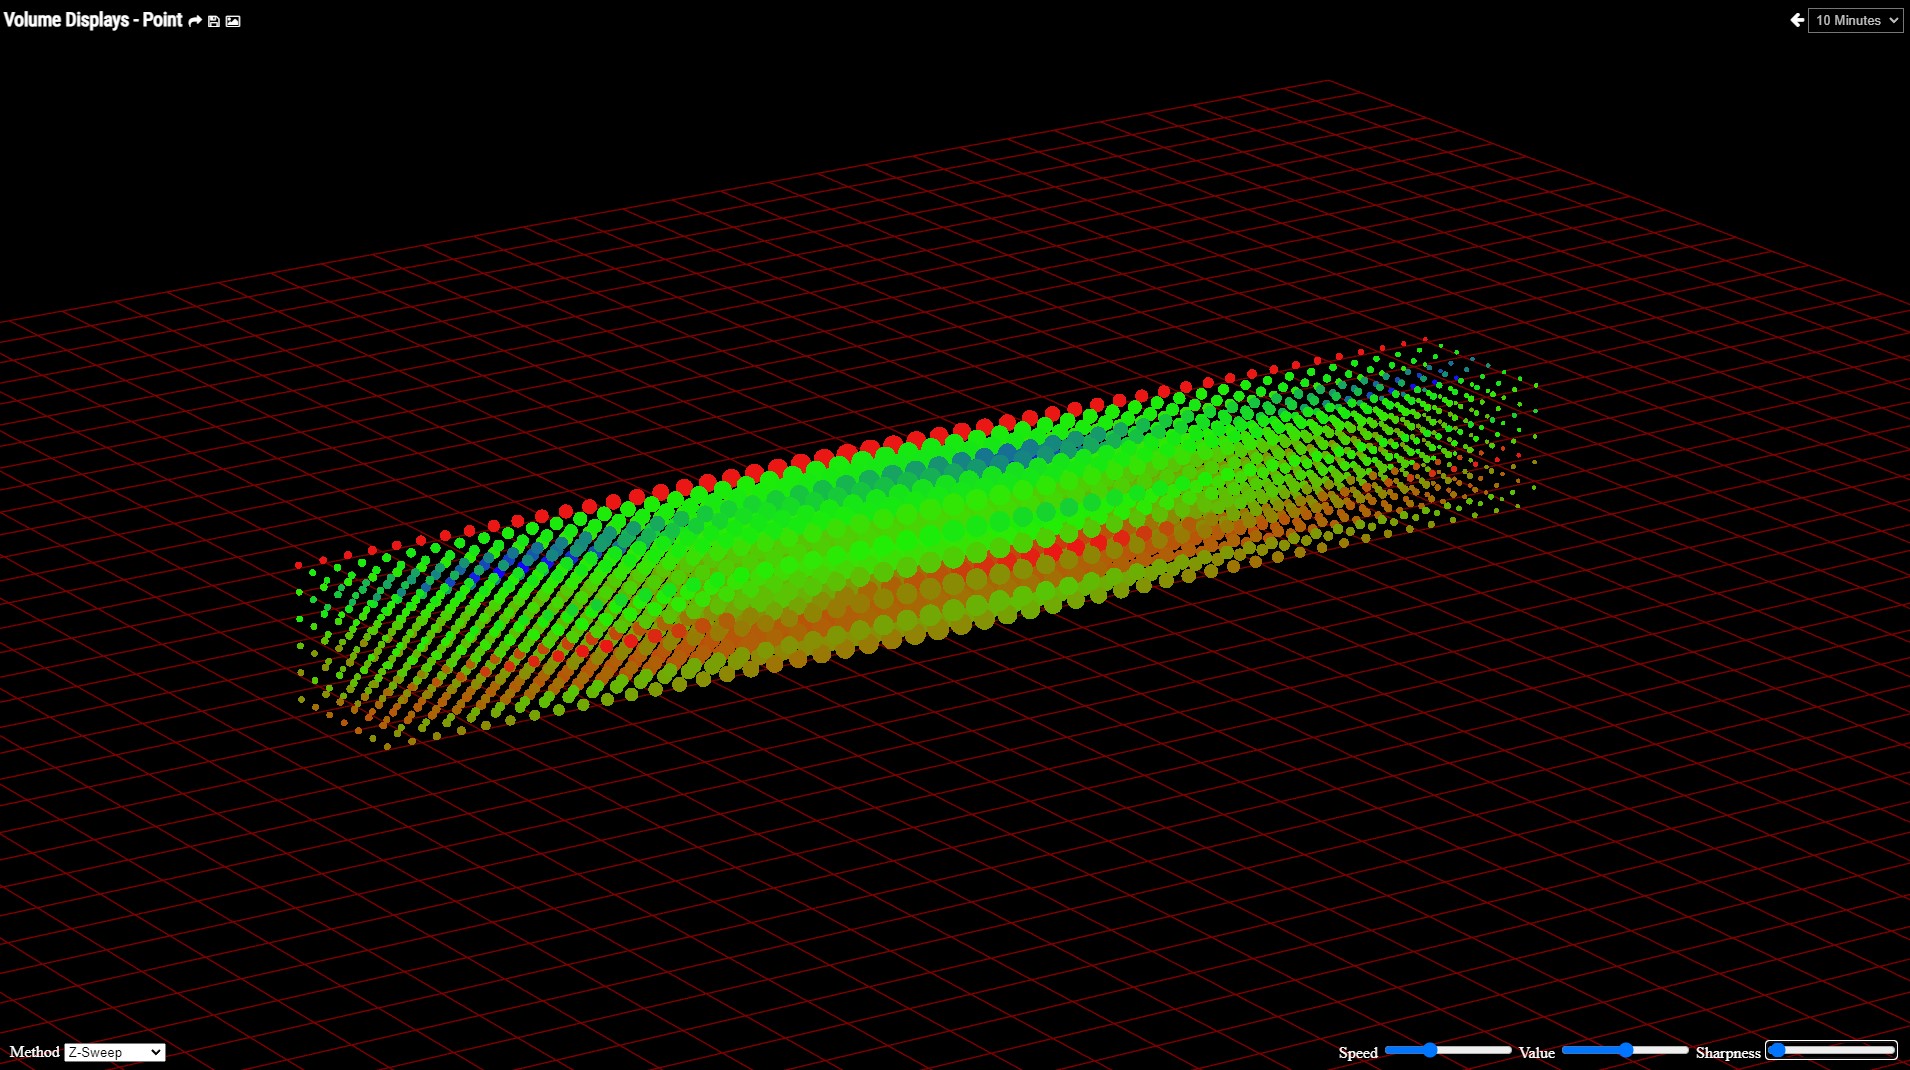
Point Volume Display
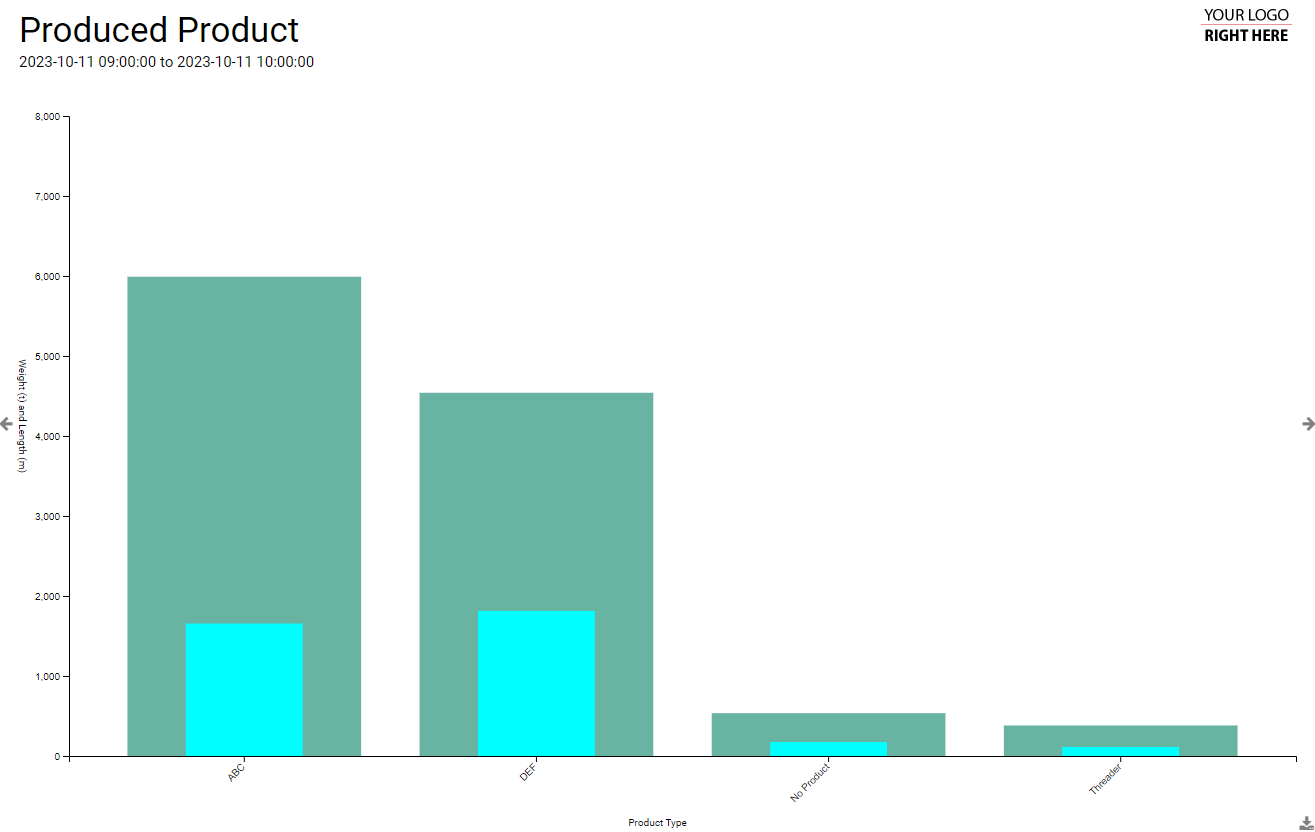
Interactive Scheduled Reports
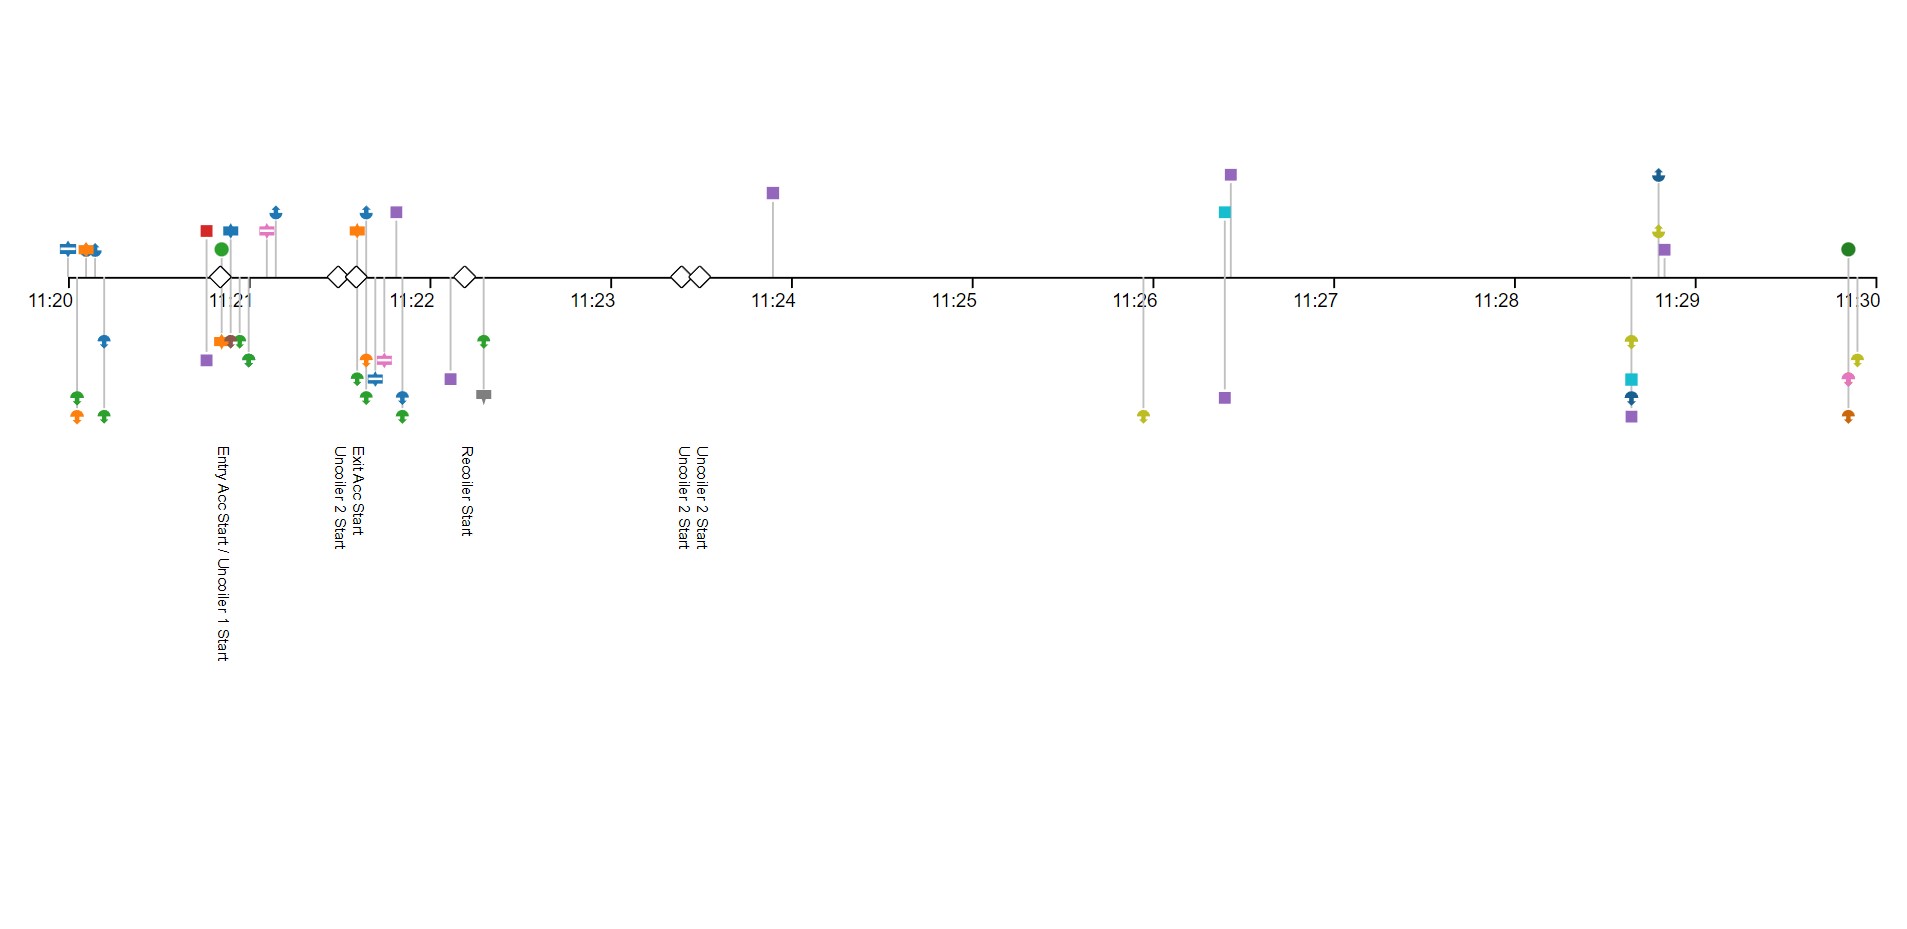
Timeline
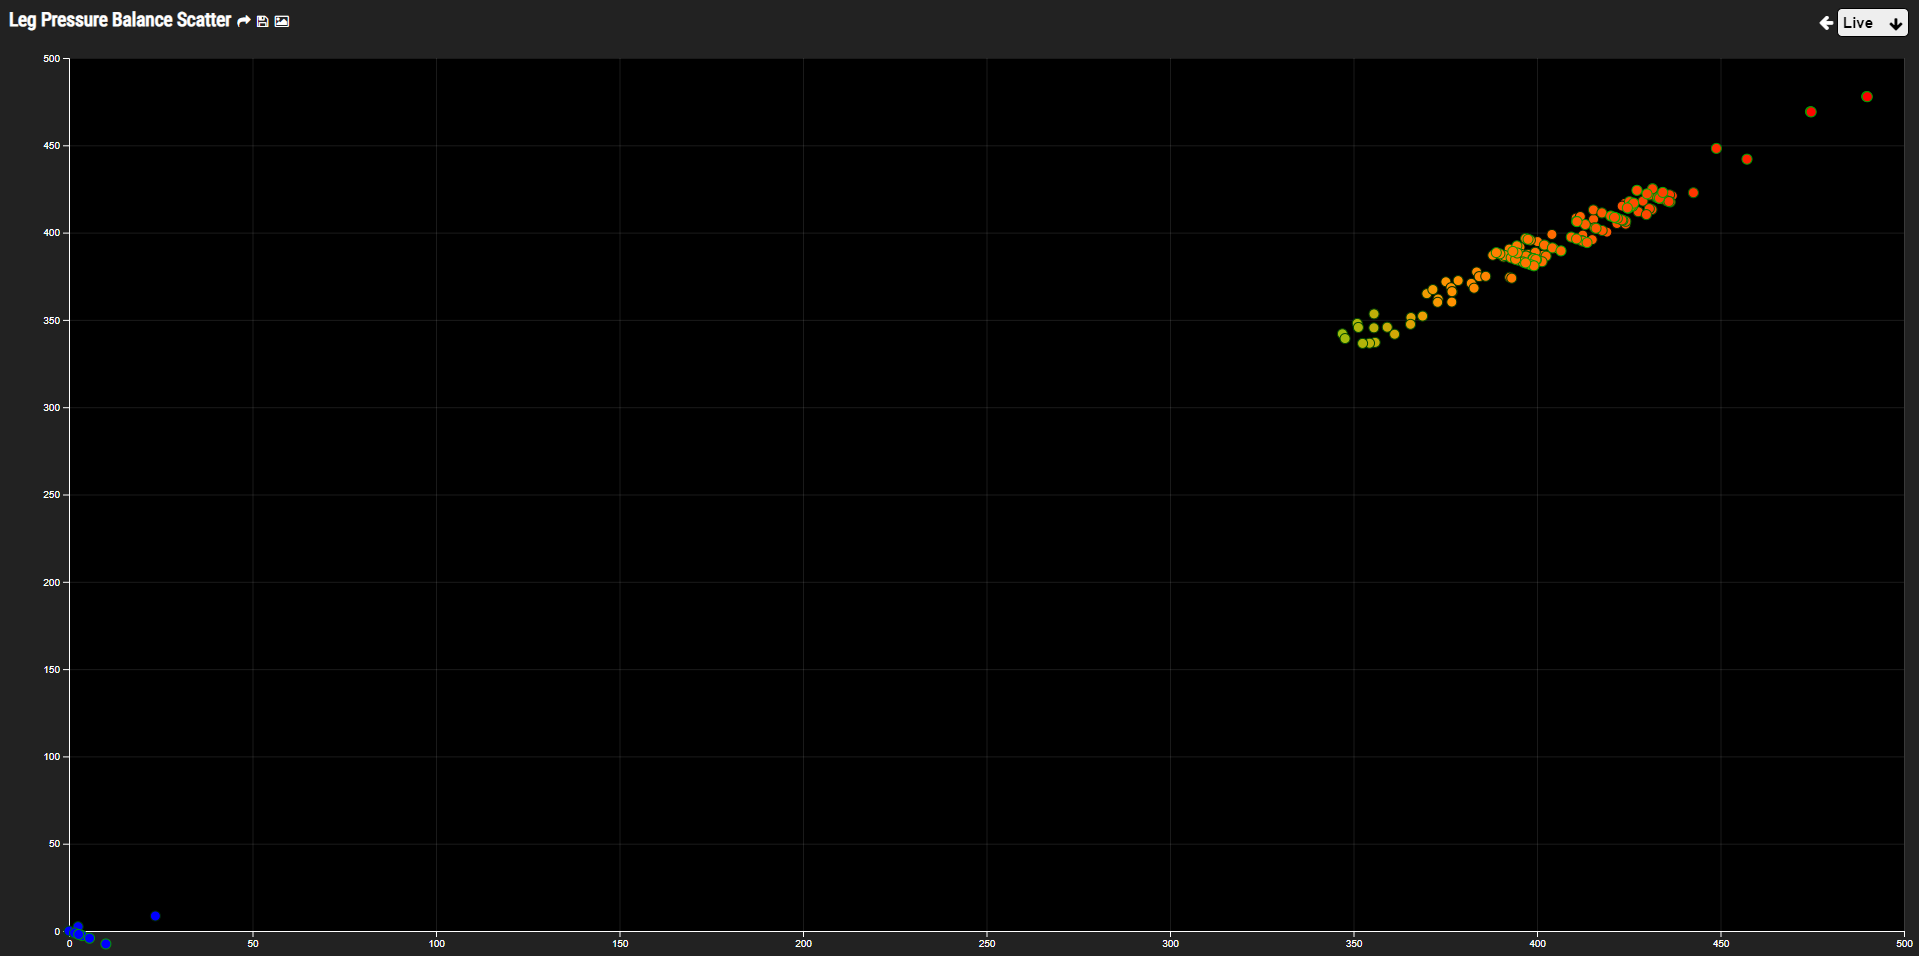
Scatter Plot
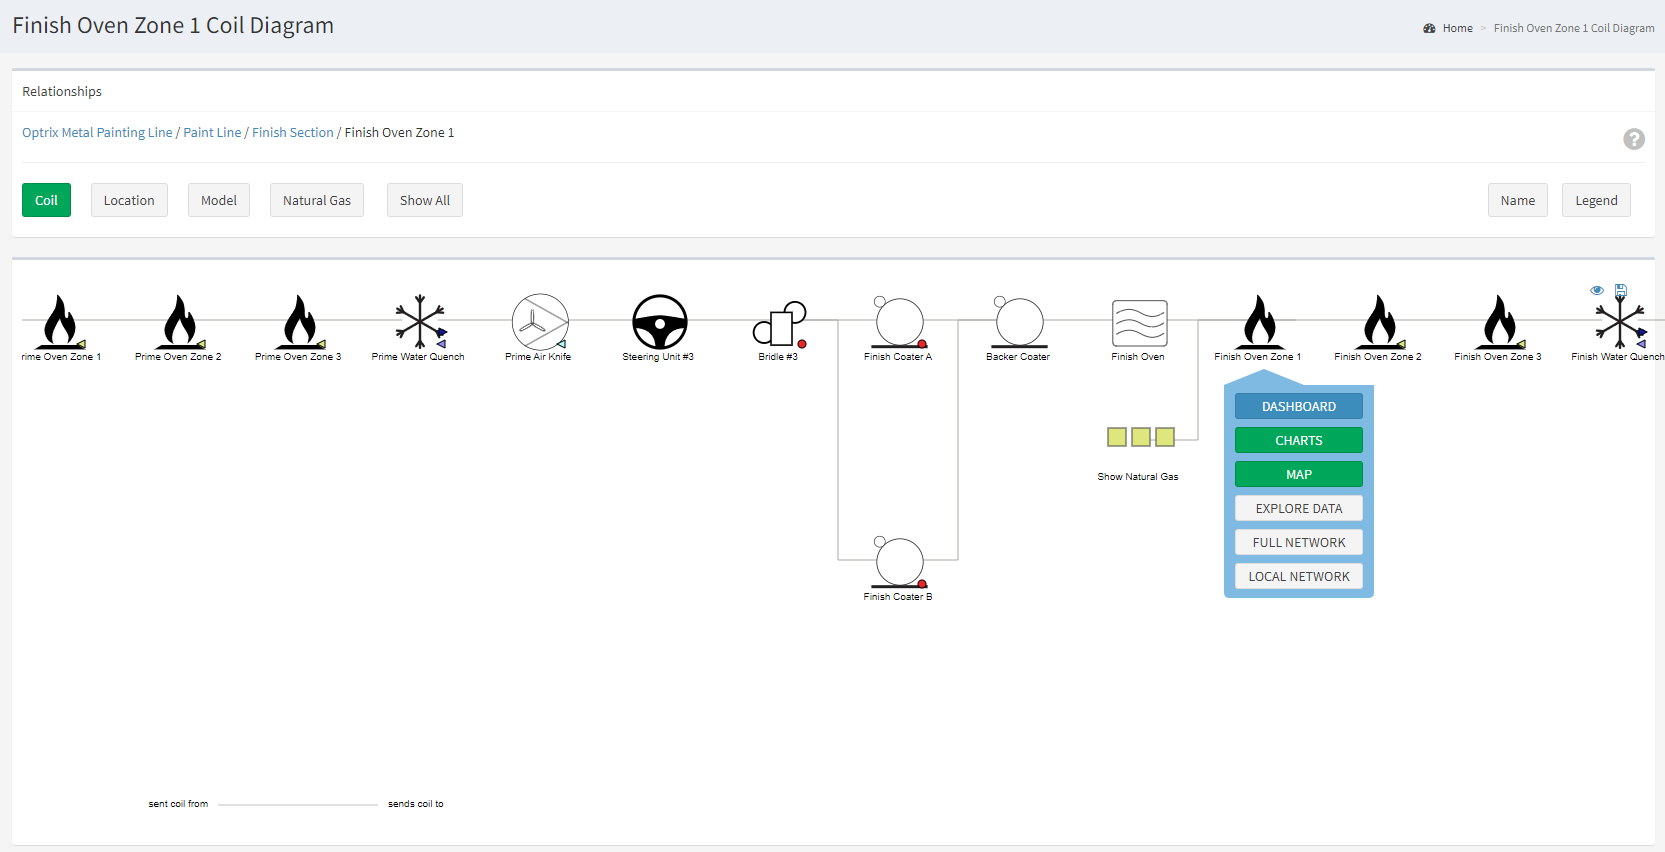
Single-Asset, Single-Relationship Diagram
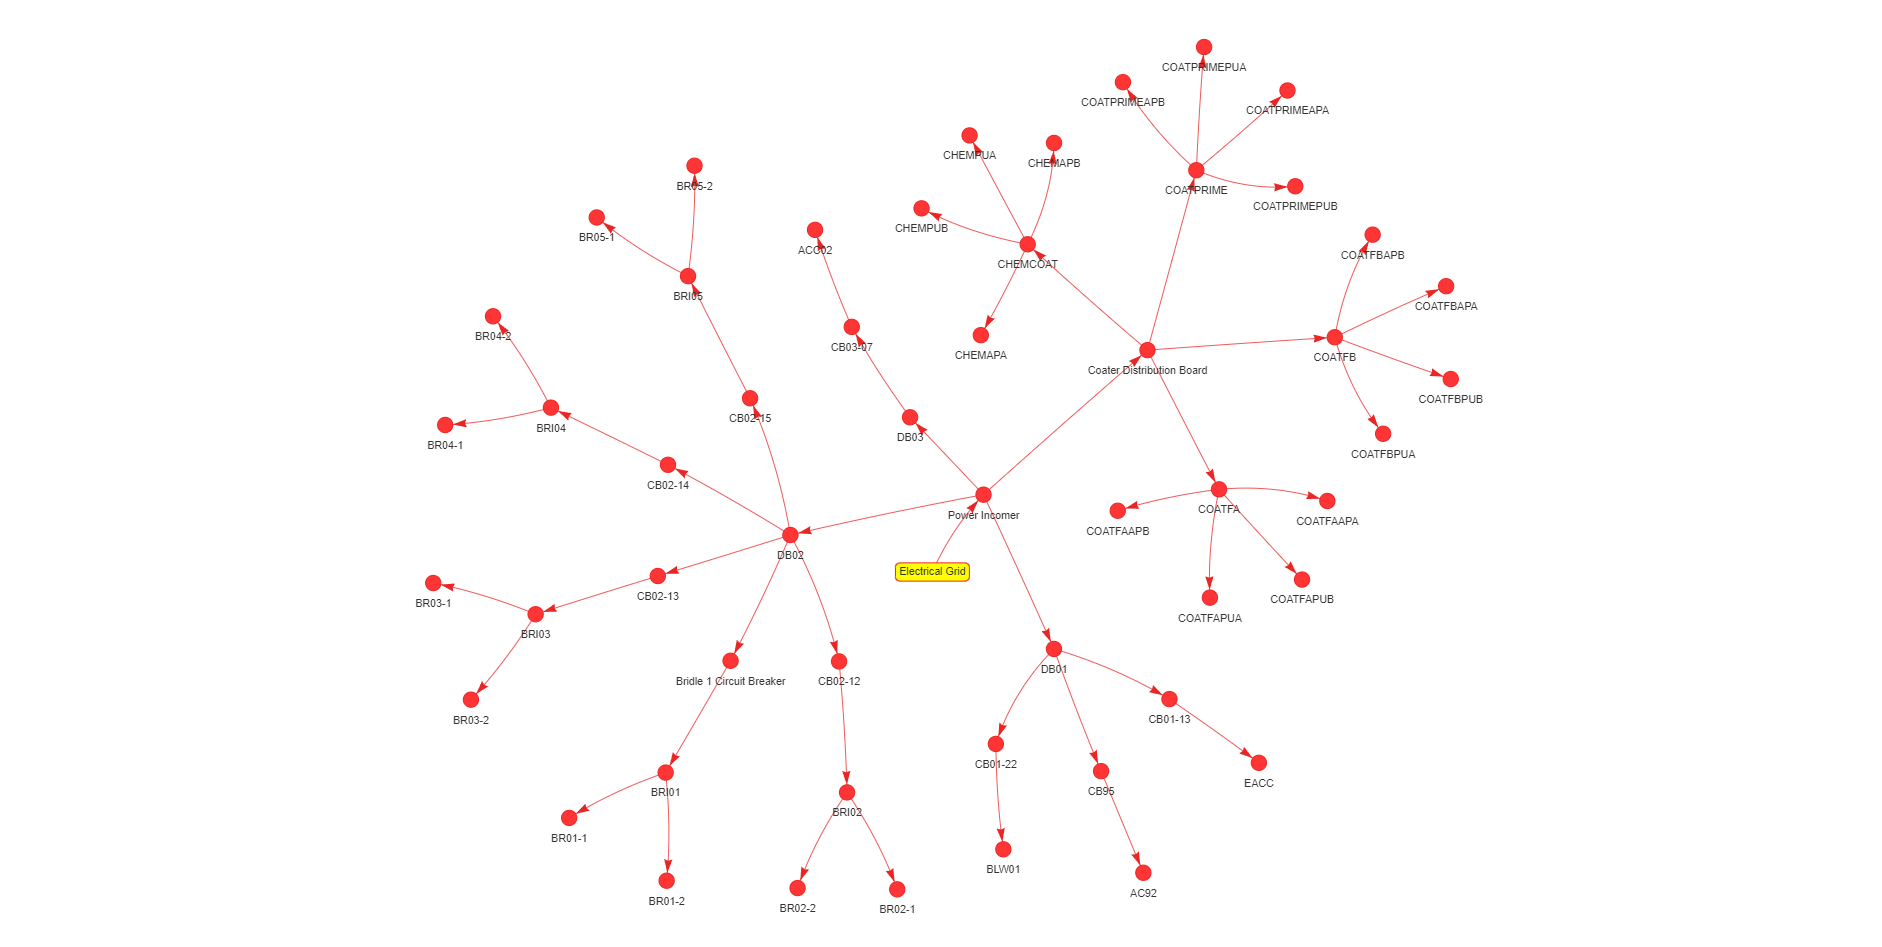
Multi-Asset, Single-Relationship Diagram
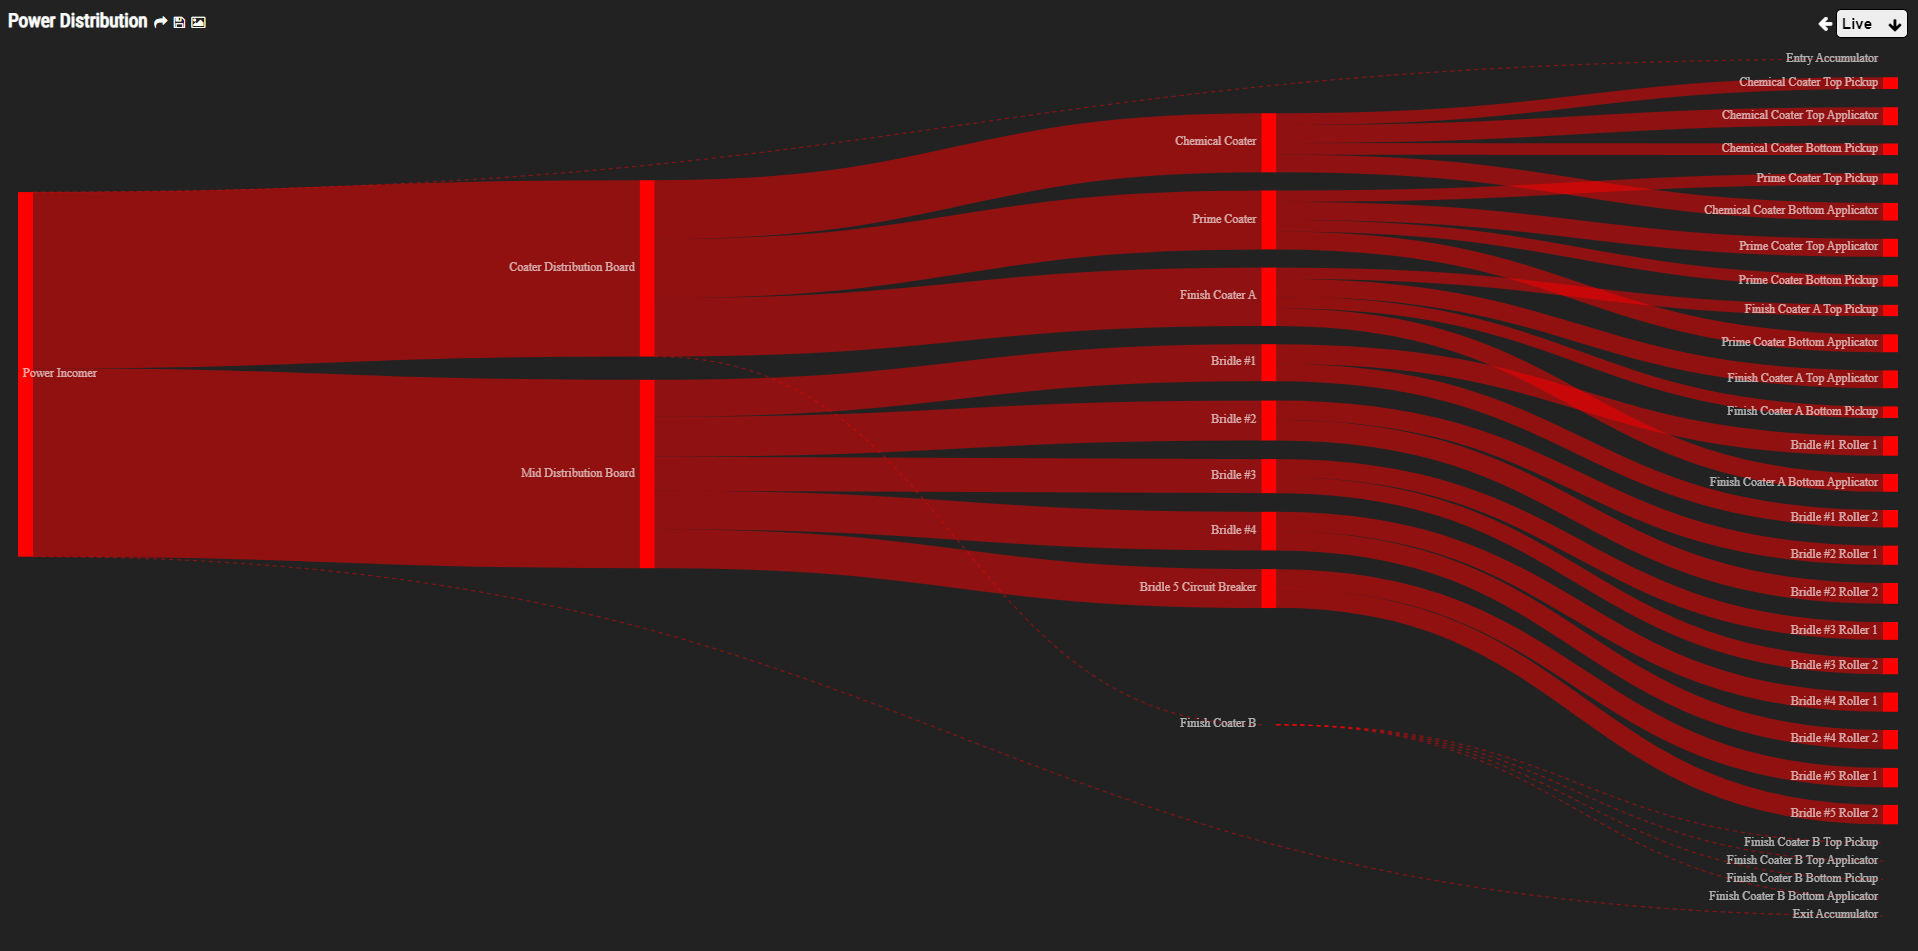
Sankey Live Flow Infographics
Hybrid Infographics
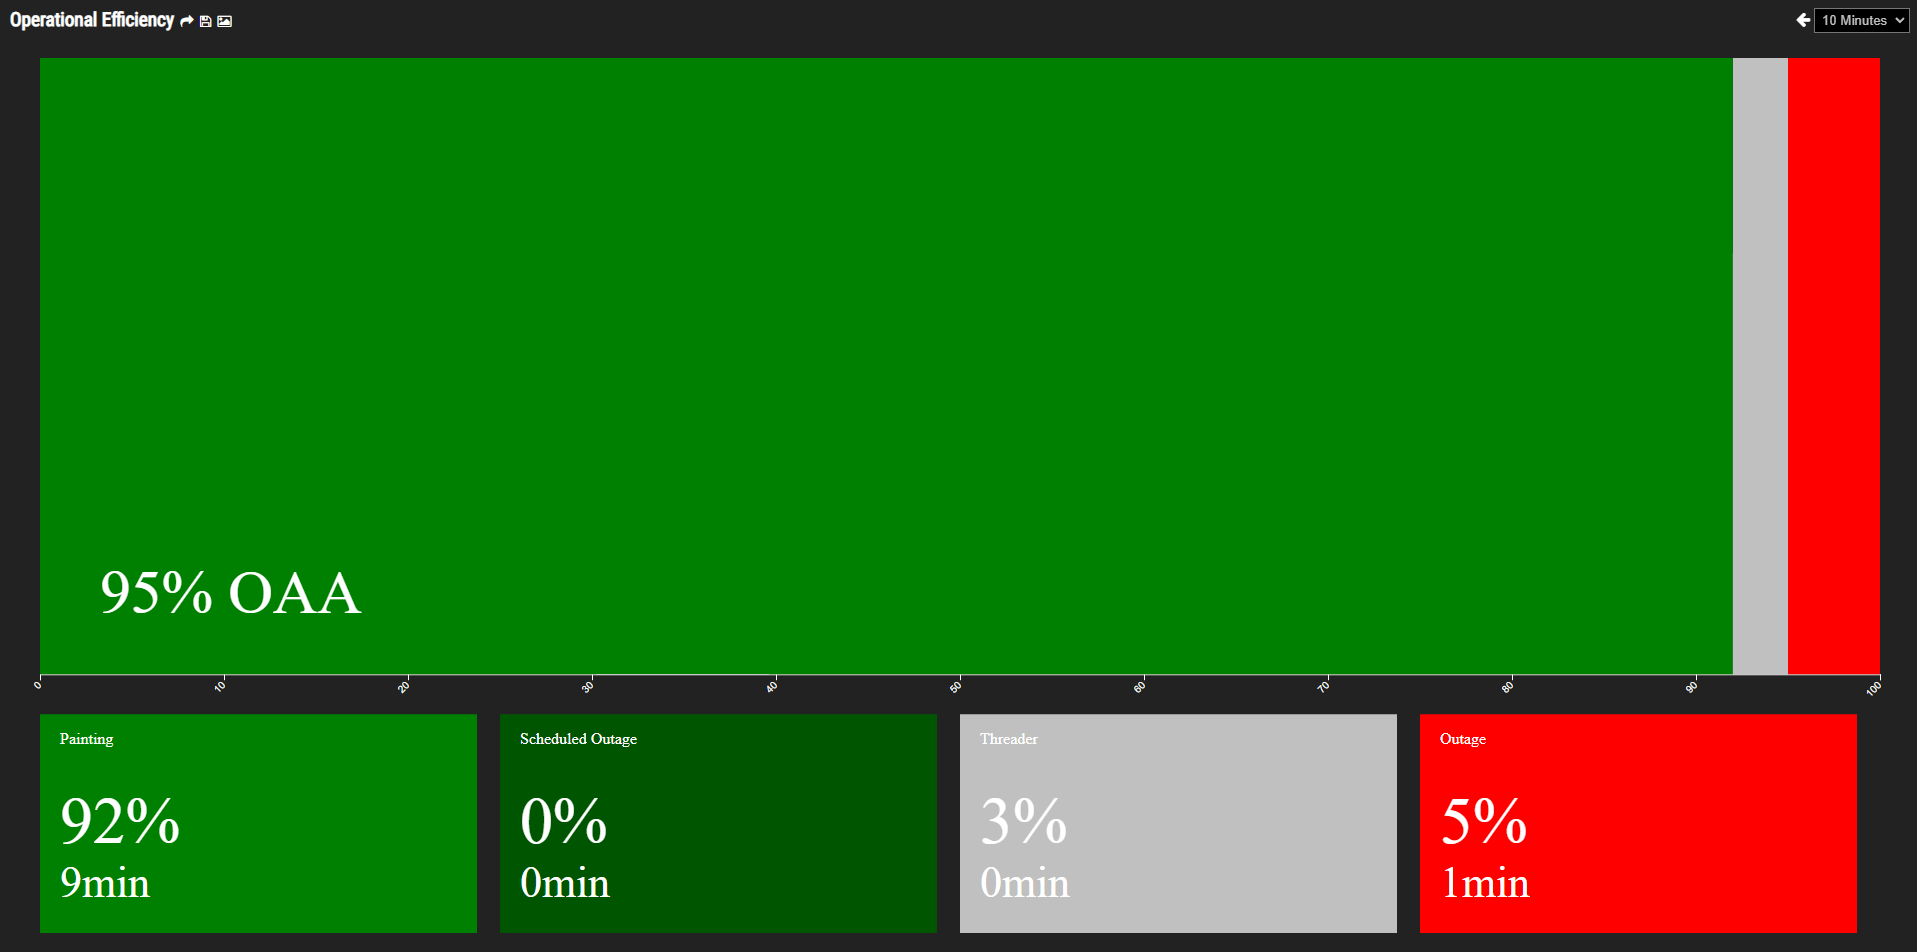
Live OEE Reporting Infographic
Sequence-Based Polar Coordinate Infographic
Time-Based Polar Coordinate Infographic
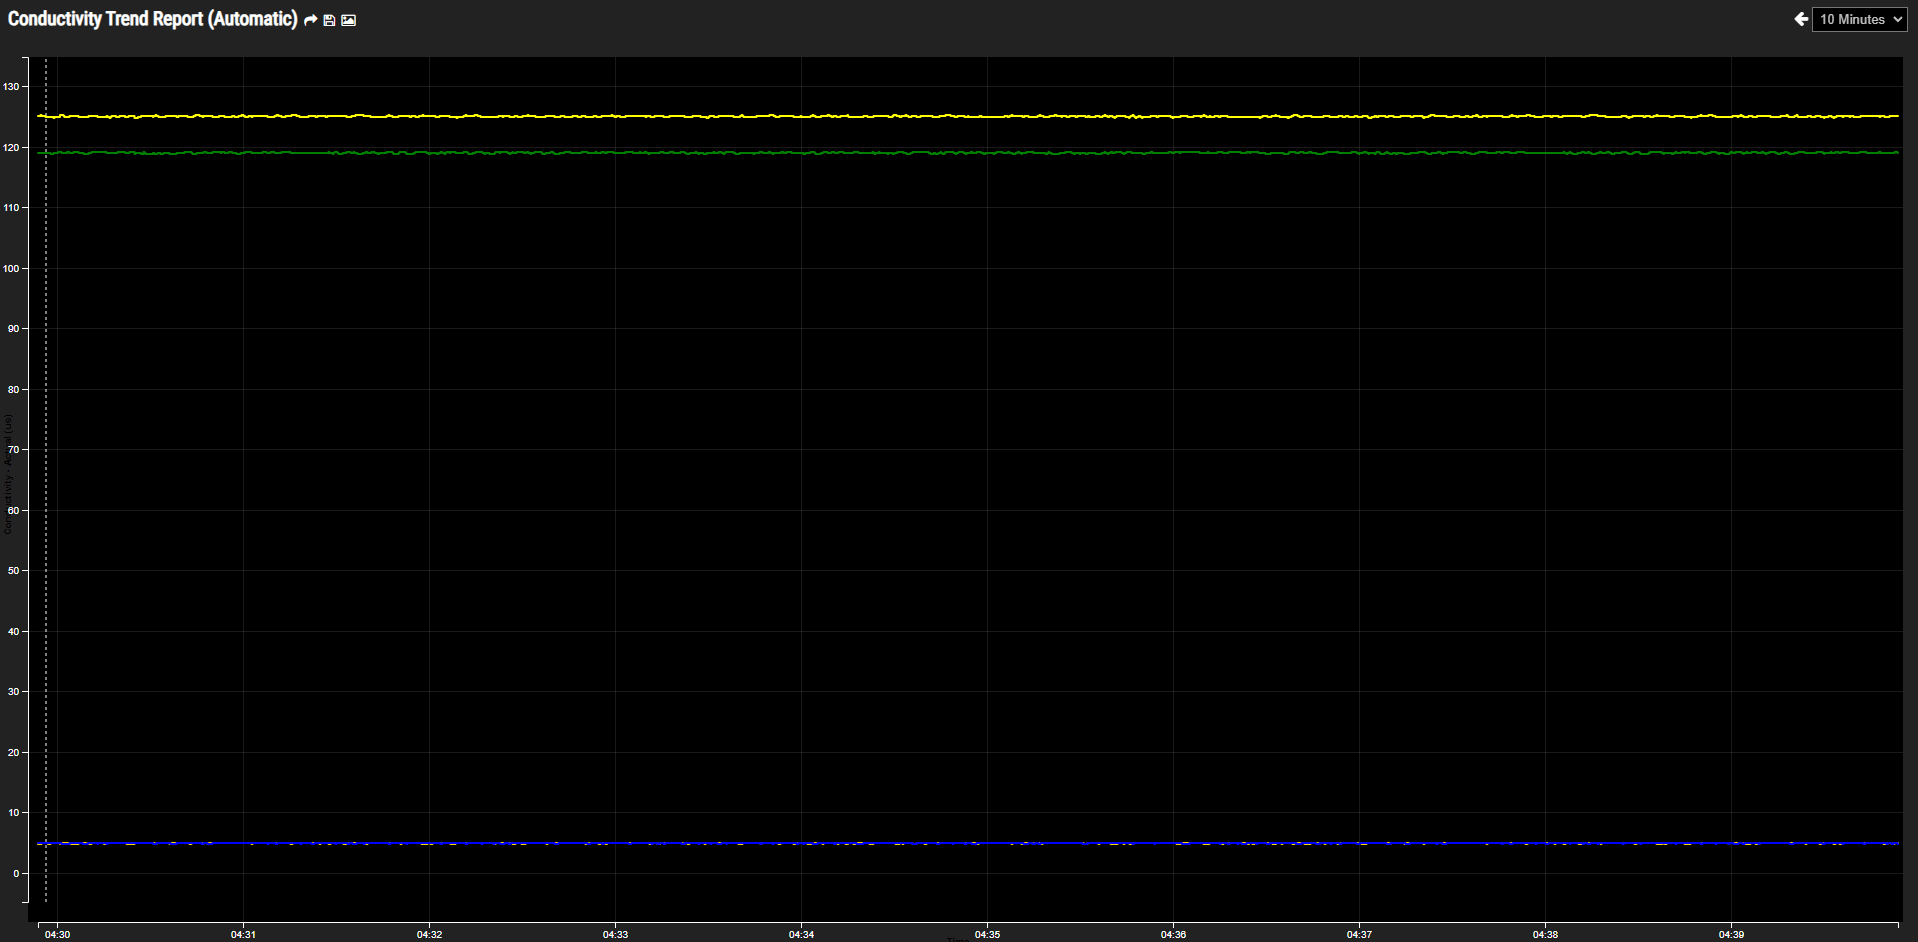
Line Chart Infographic
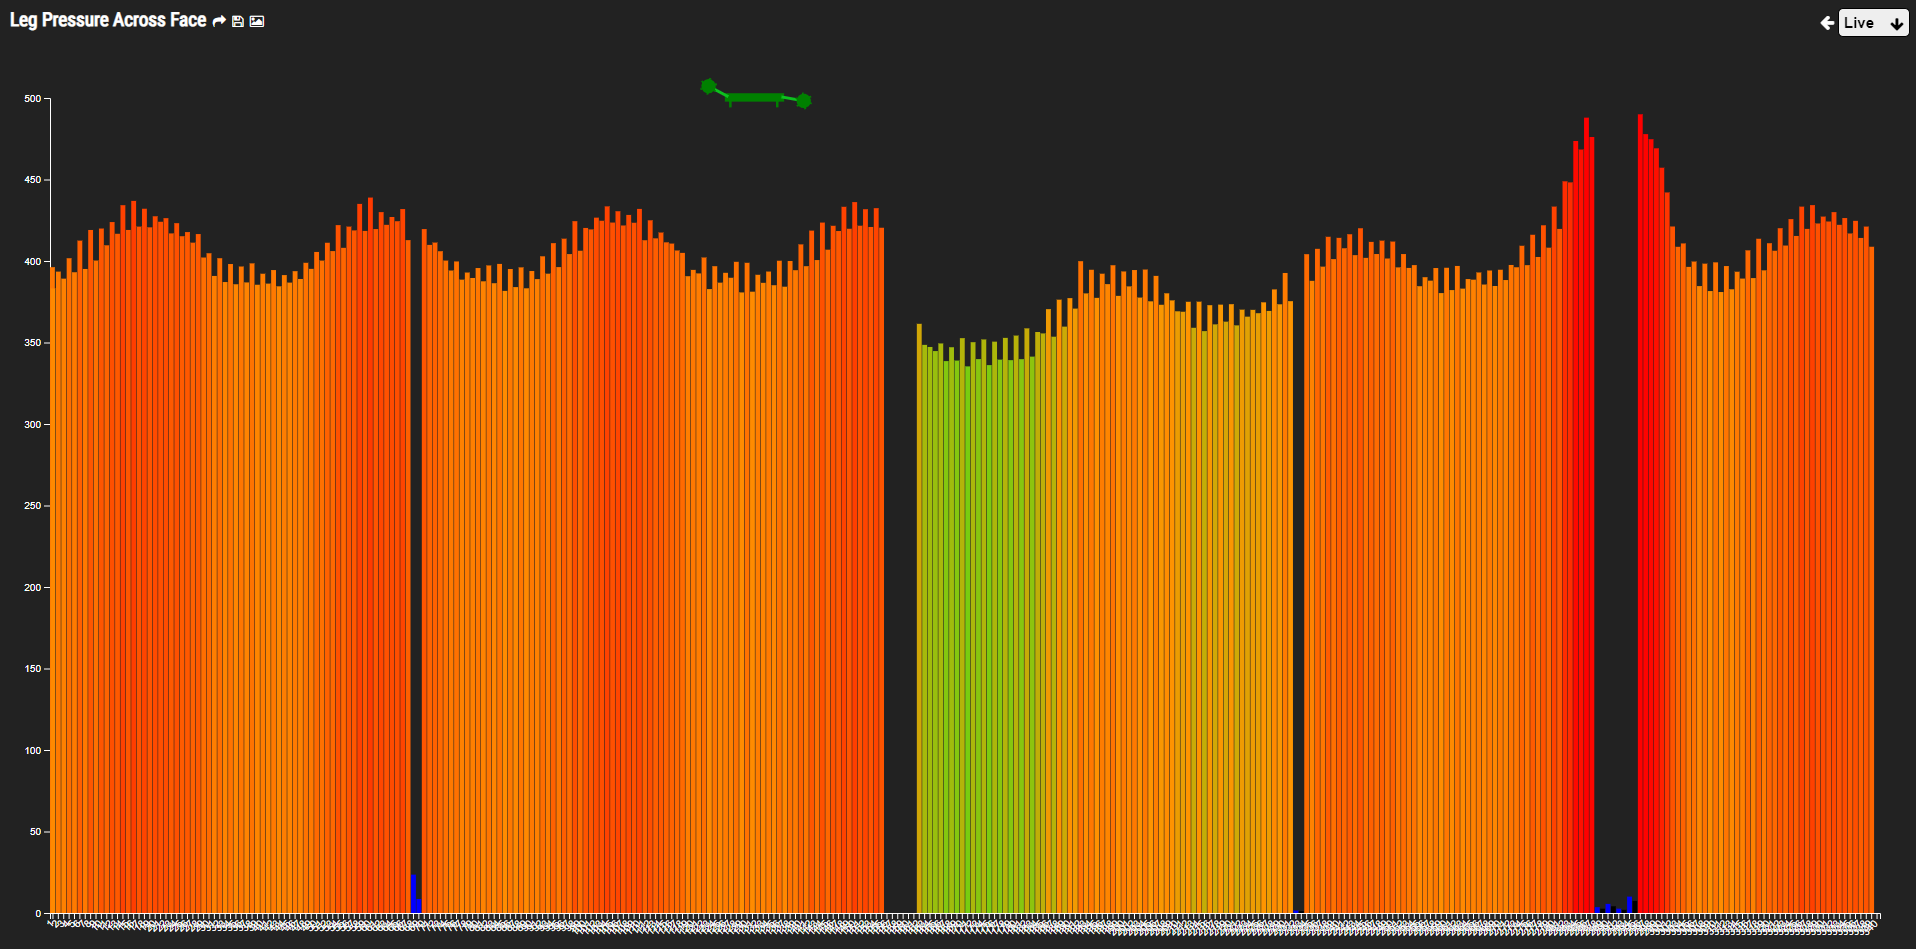
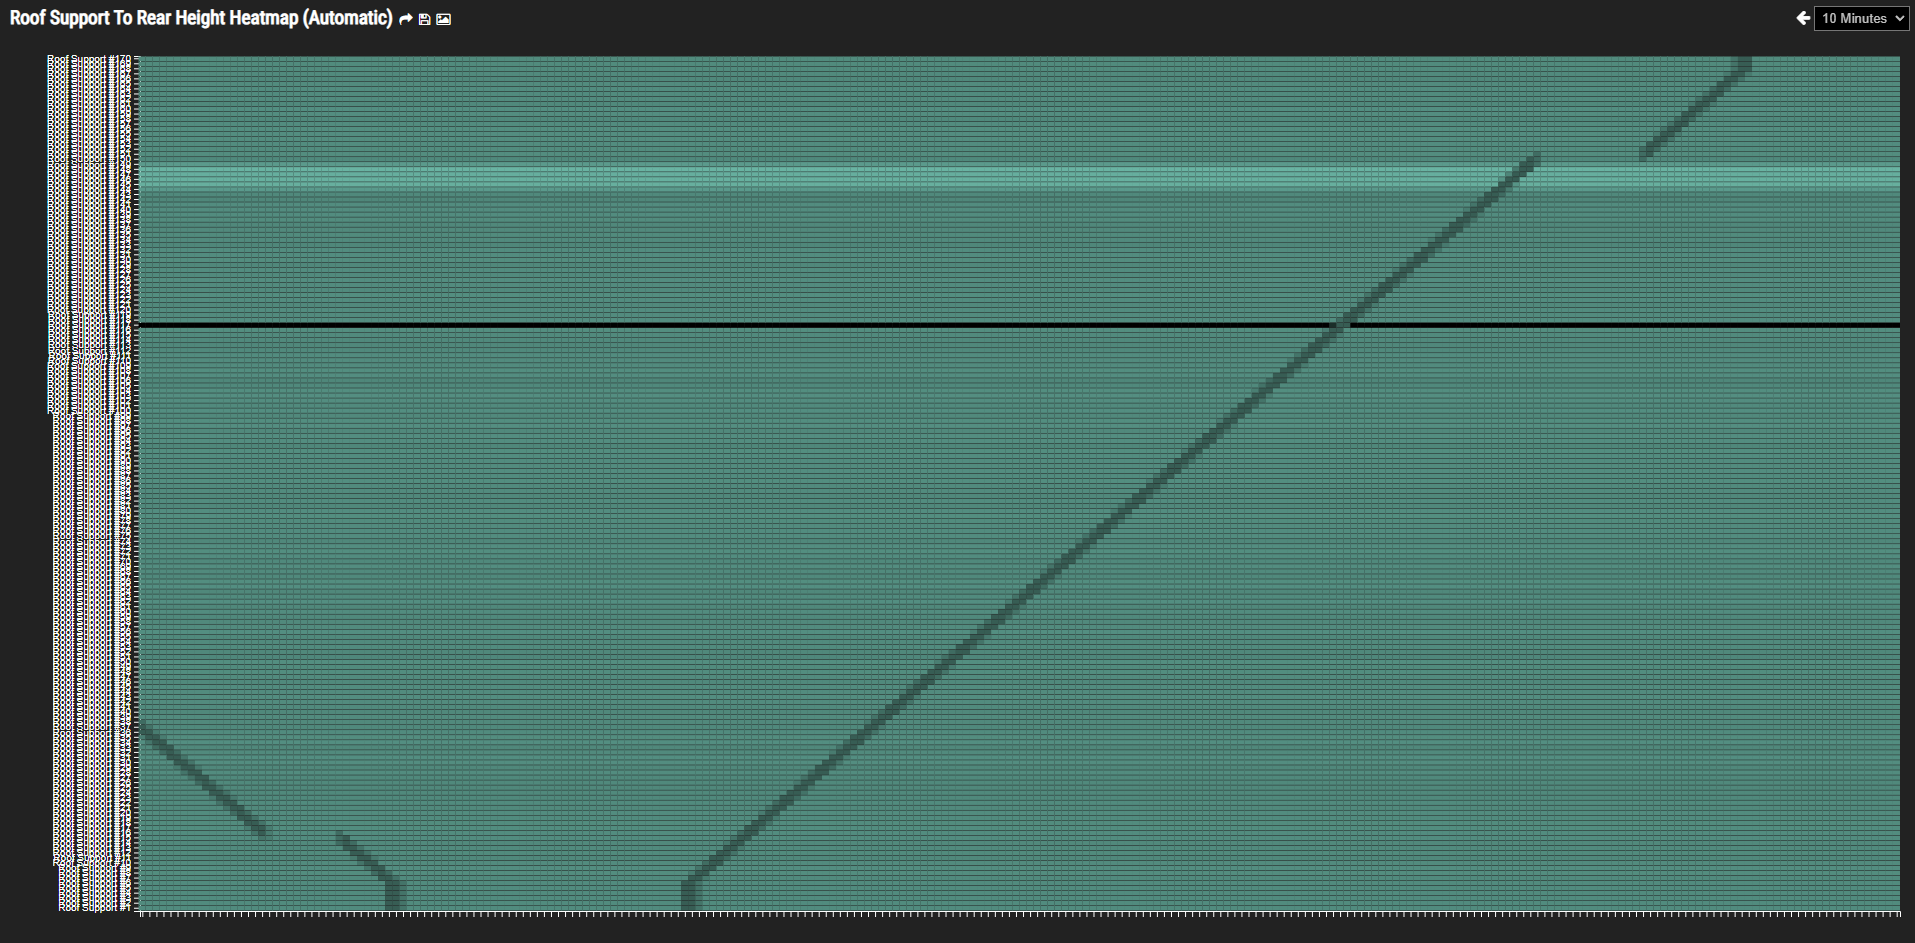
Live Heatmap Infographic
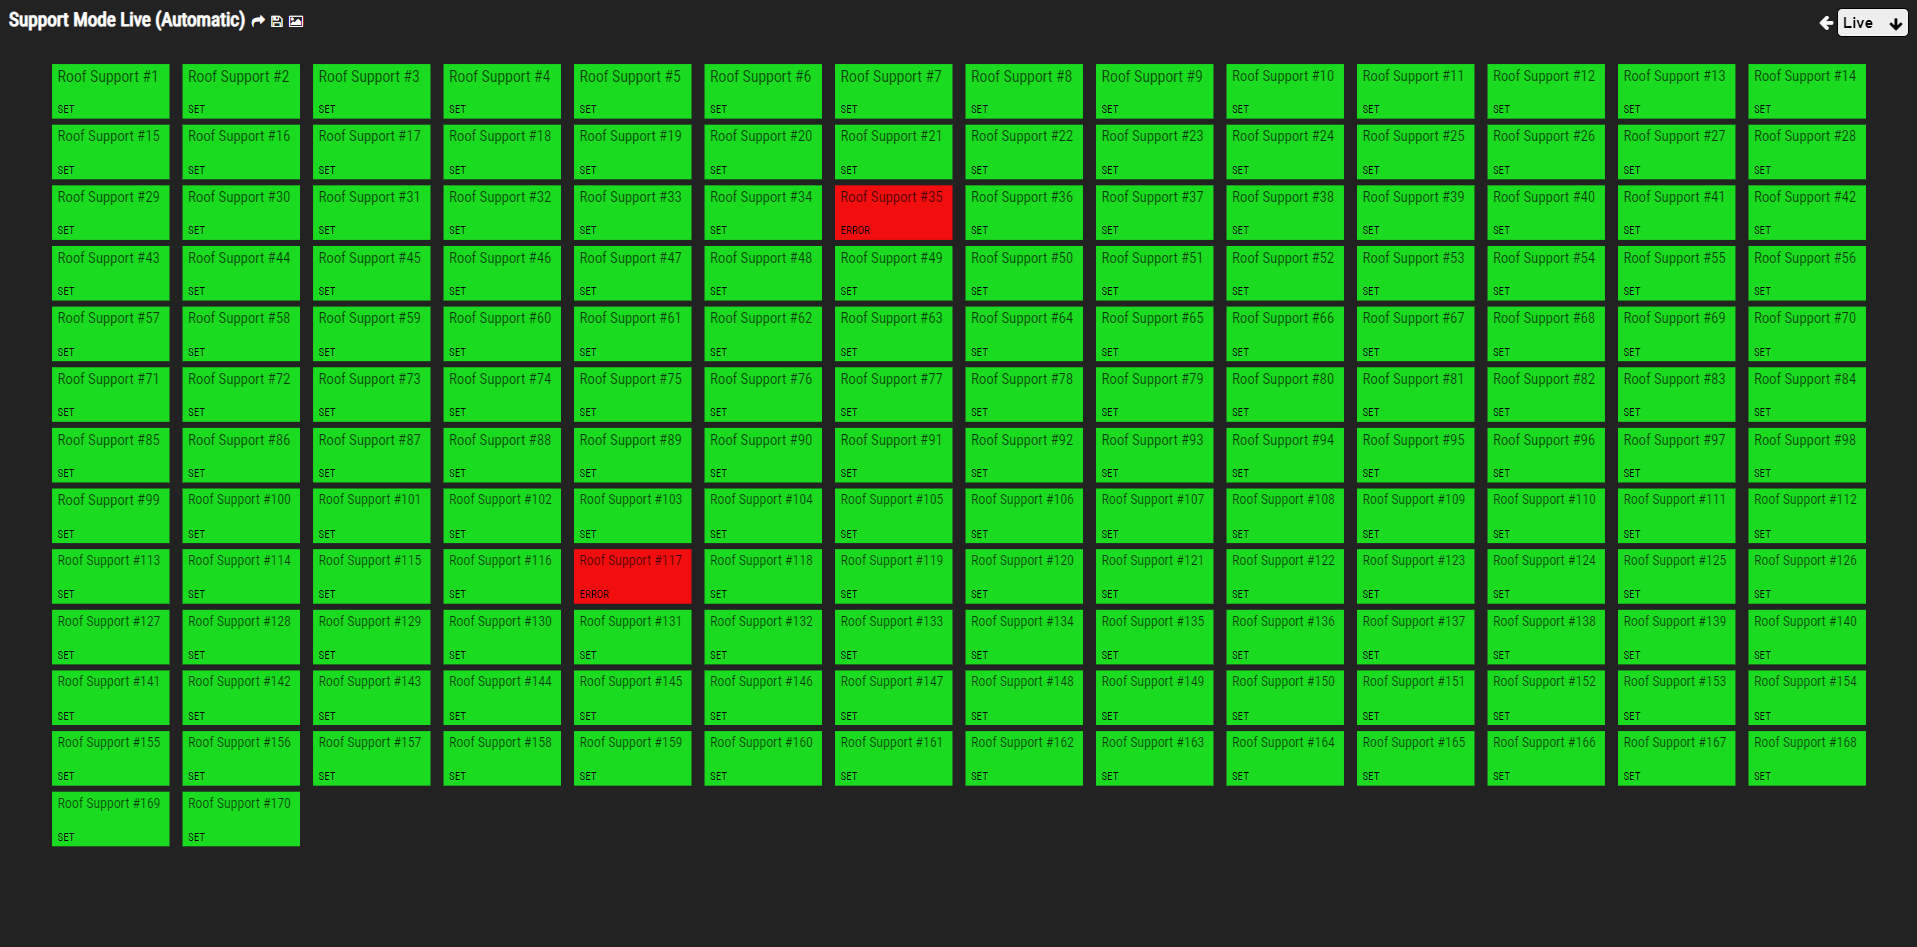
Discrete Live Status Infographic
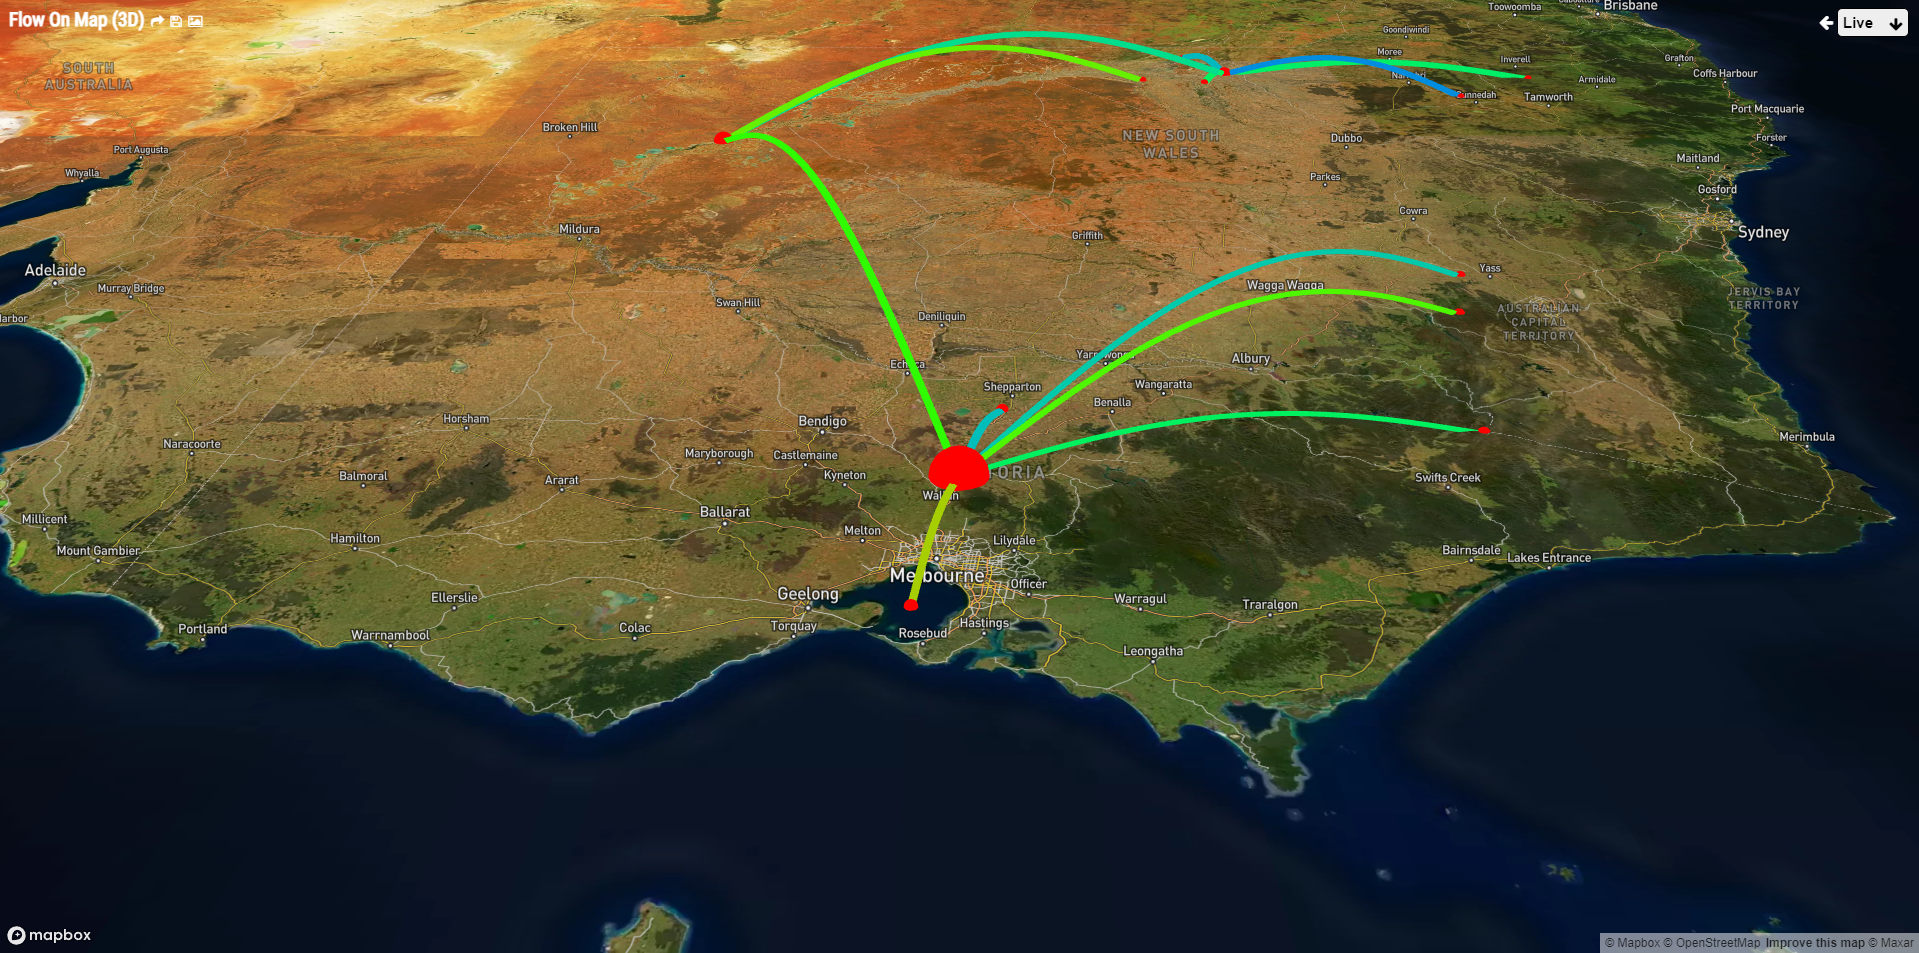
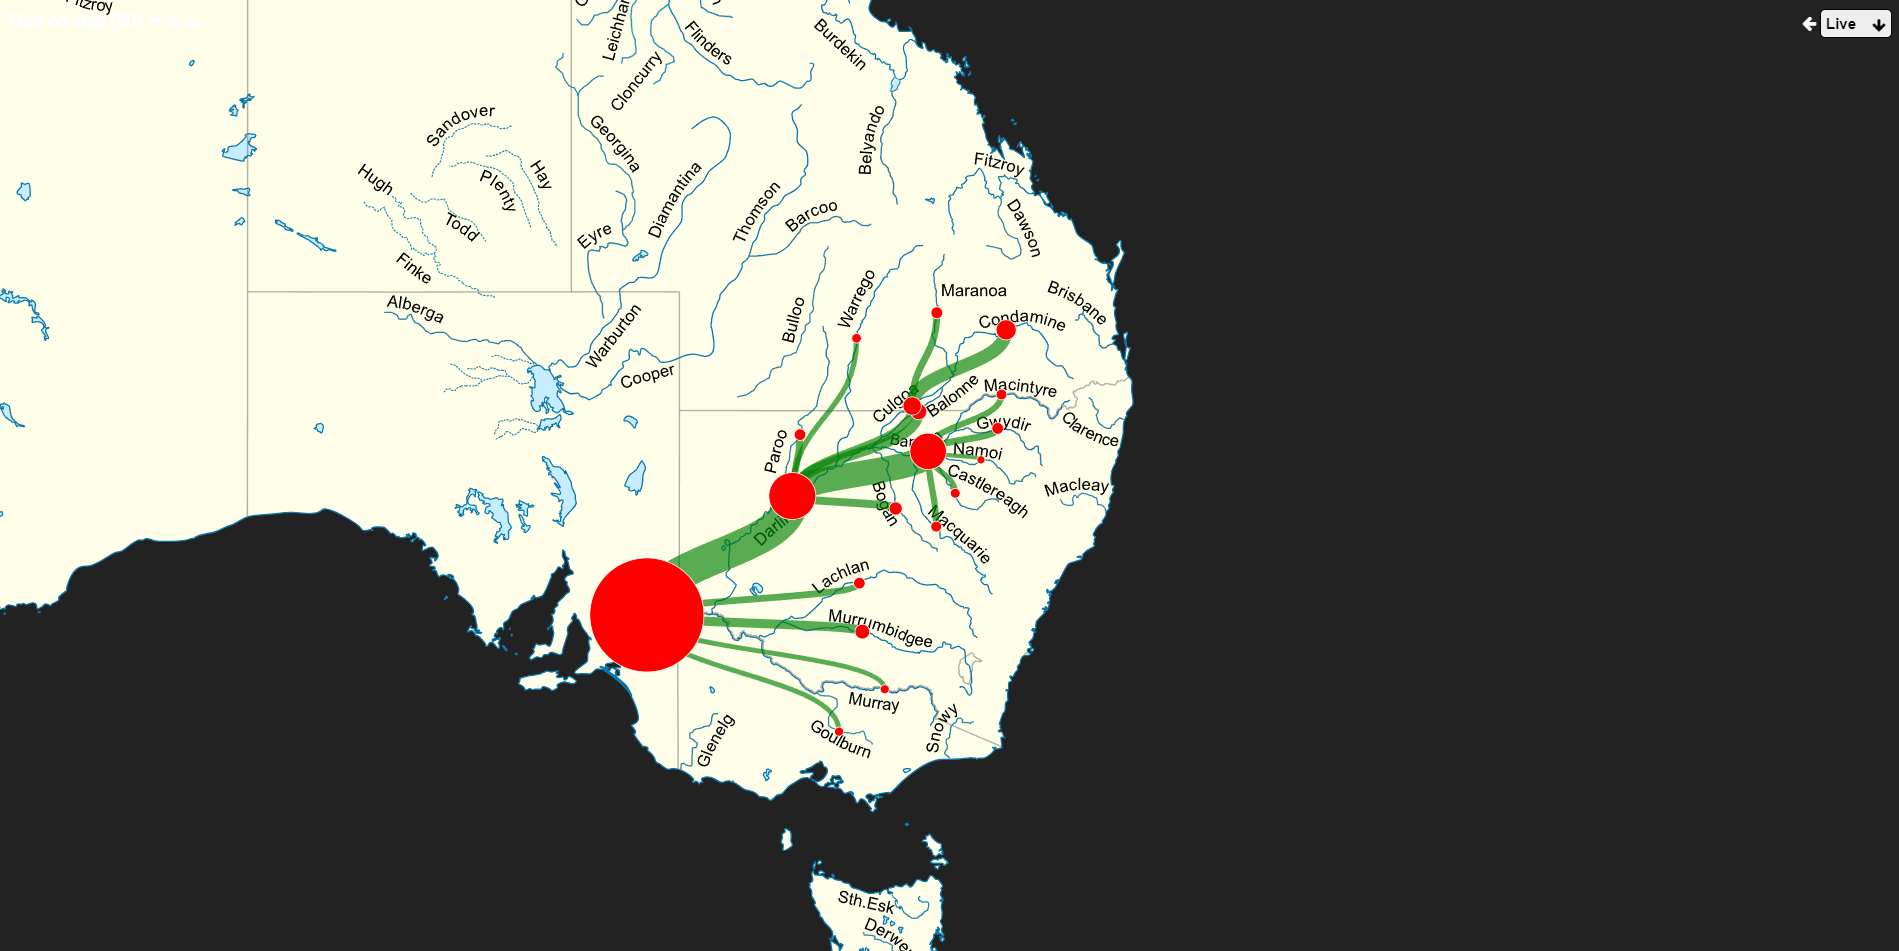
Map Infographic (3D)
Map Infographic (2D)
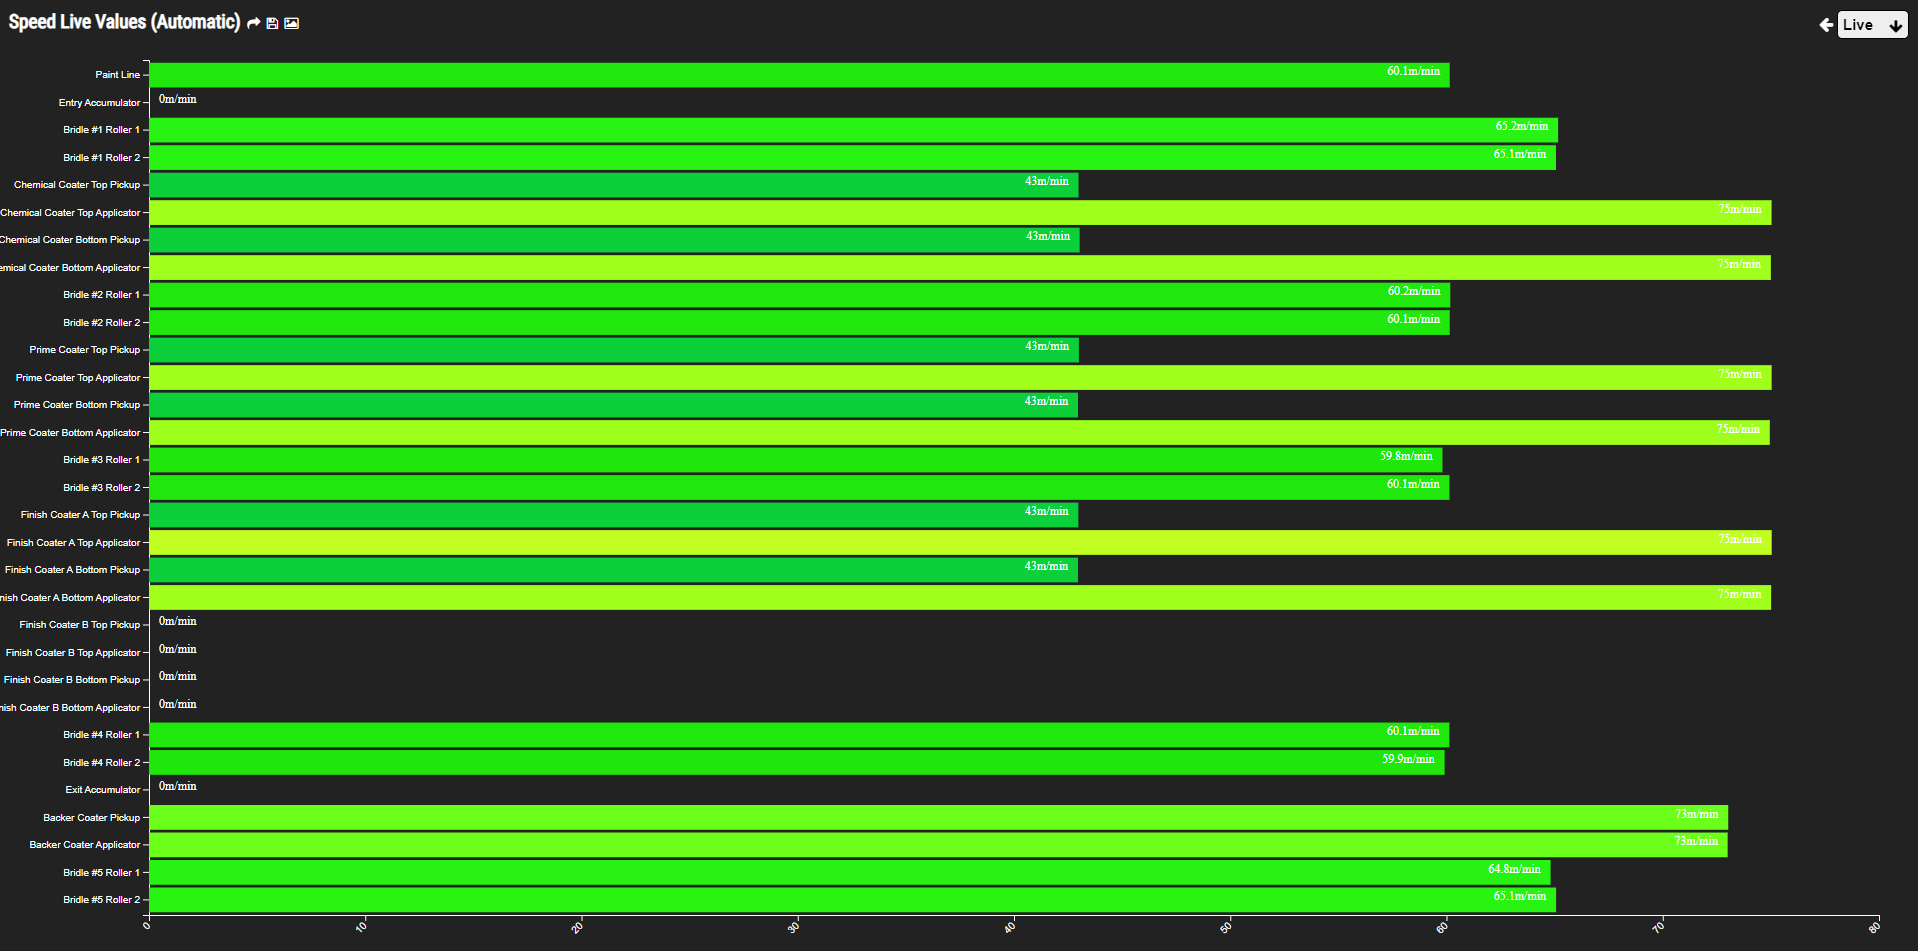
Horizontal Bar Chart Infographic (2D)