Building Better Dashboards: Integrate ARDI Data
with Grafana for Real‑Time Insights
Industrial teams thrive on clear real time dashboards, but delays or scattered data hide problems and slow decisions. Grafana, an open‑source web based dashboarding system, is popular for building interactive displays. Yet any dashboard is only as good as the data feeding it.
Without a unified source of clean, contextualised information, panels never reflect the full picture. ARDI’s Industrial DataOps platform bridges this gap by providing a consolidated, edge-ready data layer that feeds Grafana dashboards with meaningful insight. This post explores how integrating ARDI with Grafana helps operations professionals build better dashboards and deliver real time insights.
Unified Data Underpins Dashboards
Traditional industrial systems often leave data trapped in separate historians, SCADA systems and spreadsheets, forcing engineers to spend hours gathering tags and aligning time stamps. ARDI consolidates information from monitoring and control systems, historians, sensors and production databases without duplicating data. Data points are mapped to the physical assets, processes and locations they belong to, making information human readable. This unified approach eliminates manual wrangling and ensures that Grafana panels reflect current and accurate values.
Bring Reports to Life
While static reports still have a place, operations teams need fresh, interactive displays. ARDI’s interactive reporting suite includes Grafana powered dashboards, a dynamic Data Explorer and a flexible Infographics engine. Grafana is easy to deploy and allows engineers to build attractive displays. Data Explorer automatically creates charts based on your ARDI configuration and lets users zoom, compare and drill into data. The Infographics engine enables more complex web based visualisations for bespoke presentations. All these tools draw from ARDI’s unified data model, so reports are meaningful and actionable.
Real Time Insights
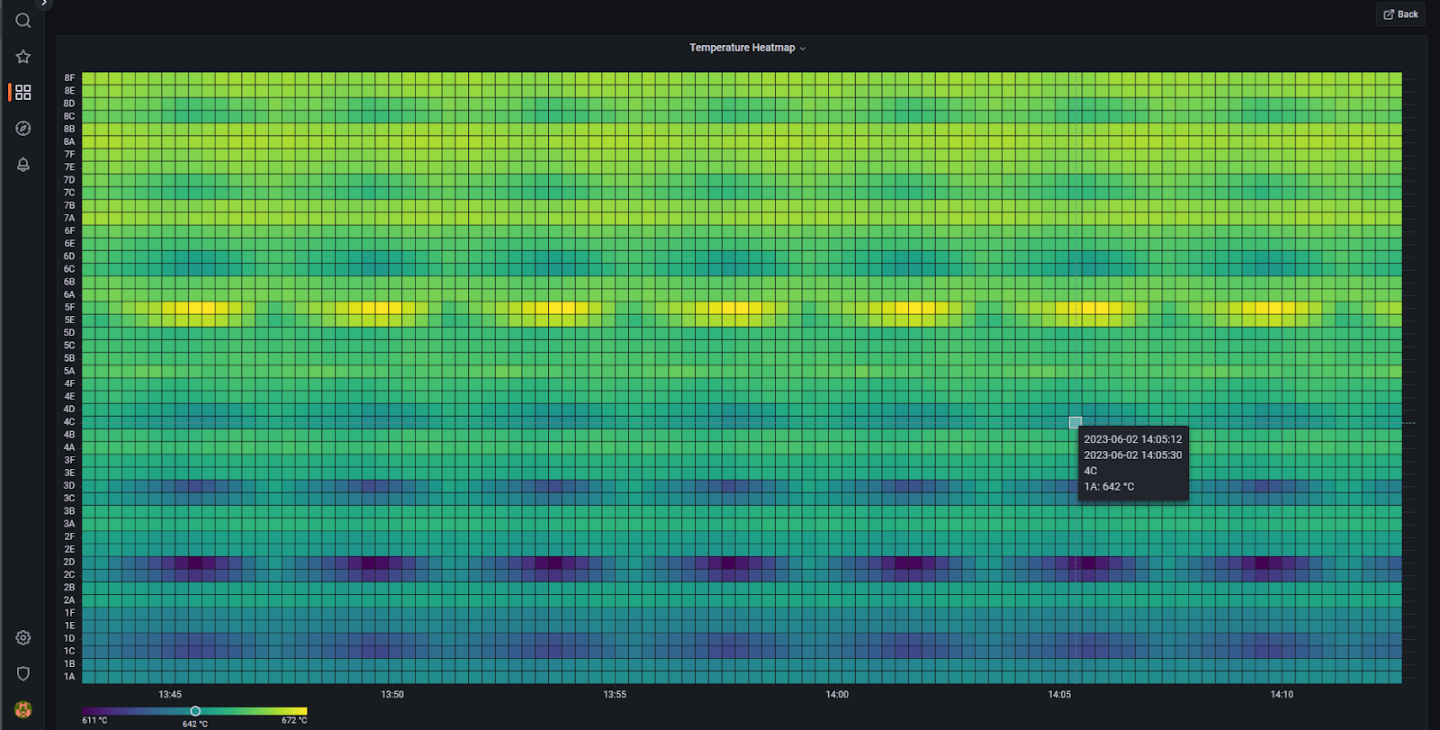
Integrating ARDI with Grafana turns dashboards into a real time window into operations. ARDI’s plugin for Grafana lets you add live process values, events and alerts using human readable terms. With an edge ready architecture, ARDI can run locally or in the cloud, so data flows with minimal latency. The open nature of Grafana means you can combine ARDI data with other sources, compare performance across shifts or sites and trigger alerts for abnormal conditions. Real time insights support rapid decision making, whether adjusting set points, balancing loads or scheduling maintenance.
Empower Your Team
For engineers and analysts who love data, consolidating and contextualising information reduces the need to hunt through spreadsheets or decipher tag codes. Edge first deployment ensures responsive dashboards even in bandwidth constrained environments. Operators can explore data themselves through Data Explorer or view interactive infographics tailored to their role. This democratisation of insight fosters collaboration and continuous improvement across departments.
Elevate Your Dashboards with ARDI and Grafana
If your dashboards feel static or fail to capture the full picture, it’s time to rethink your data foundation. ARDI provides a unified source of truth that feeds Grafana, Data Explorer and Infographics. By consolidating and contextualising information, ARDI eliminates silos and keeps visualisations accurate and reliable. Its edge‑ready architecture ensures real‑time flow of data, while the flexible Grafana plug-in makes connection simple and scalable. The result? Dynamic dashboards that deliver actionable insights and empower data‑driven decisions across your organisation.
Ready to see what this looks like in practice? Explore the ARDI Grafana add‑on on the Grafana download page, explore into our interactive reporting suite, or get in touch with our team for a tailored demonstration.